
Indicator · Q3 2026
Dubai residential sales volume and value
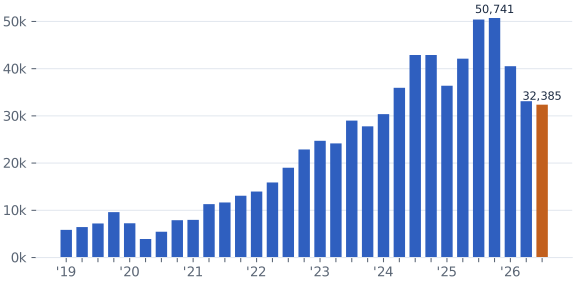
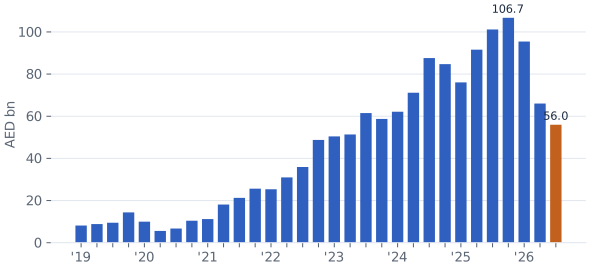
Dubai registered 32,385 residential sales in Q3 2026, -35.8% on Q3 2025 and -2.2% on Q2 2026, worth AED 56.0bn (-44.7% y/y). The record quarter was Q4 2025 with 50,741 sales.
Charts
Quarterly residential sales in Dubai, 2019 to Q3 2026
Quarterly residential sales value in Dubai, AED bn, 2019 to Q3 2026
Data
Dubai residential sales by quarter
| Quarter | Sales | Value (AED bn) | Median price (AED m) |
|---|---|---|---|
| Q3 2026 | 32,385 | 56.0 | 1.15 |
| Q2 2026 | 33,117 | 66.0 | 1.26 |
| Q1 2026 | 40,533 | 95.4 | 1.56 |
| Q4 2025 | 50,741 | 106.7 | 1.38 |
| Q3 2025 | 50,412 | 101.2 | 1.32 |
| Q2 2025 | 42,129 | 91.6 | 1.35 |
| Q1 2025 | 36,388 | 76.1 | 1.46 |
| Q4 2024 | 42,896 | 84.7 | 1.35 |
| Q3 2024 | 42,905 | 87.6 | 1.49 |
| Q2 2024 | 35,949 | 71.2 | 1.38 |
| Q1 2024 | 30,367 | 62.1 | 1.35 |
| Q4 2023 | 27,785 | 58.7 | 1.40 |
| Q3 2023 | 29,005 | 61.5 | 1.40 |
| Q2 2023 | 24,171 | 51.4 | 1.40 |
| Q1 2023 | 24,727 | 50.4 | 1.35 |
| Q4 2022 | 22,893 | 48.8 | 1.49 |
| Q3 2022 | 19,017 | 35.9 | 1.32 |
| Q2 2022 | 15,893 | 31.0 | 1.40 |
| Q1 2022 | 13,975 | 25.3 | 1.31 |
| Q4 2021 | 13,080 | 25.6 | 1.49 |
| Q3 2021 | 11,659 | 21.3 | 1.33 |
| Q2 2021 | 11,303 | 18.1 | 1.15 |
| Q1 2021 | 7,973 | 11.2 | 1.03 |
| Q4 2020 | 7,905 | 10.4 | 1.06 |
| Q3 2020 | 5,461 | 6.7 | 0.88 |
| Q2 2020 | 3,919 | 5.6 | 1.10 |
| Q1 2020 | 7,256 | 10.0 | 1.10 |
| Q4 2019 | 9,611 | 14.4 | 1.20 |
| Q3 2019 | 7,218 | 9.5 | 1.08 |
| Q2 2019 | 6,453 | 8.8 | 1.06 |
| Q1 2019 | 5,858 | 8.2 | 1.04 |
Definition and method
A DLD transaction in group Sales with residential usage, property class apartment (Unit/Flat), villa or townhouse, registered through a market sale procedure (Sale, Sell, Delayed Sell, Sale On Payment Plan, Sell (Pre registration), Sell Development, Development Registration). Lease-to-own, land additions, hotel apartments, offices, shops and land plots are excluded. Mortgages and gifts are not sales.
Sales to 31 December 2025 come from the Dubai Data history export and sales from 1 January 2026 from the DLD daily file.
Sources
- Dubai Land Department (DLD) open transaction data, Prop971 analysis
Cite
Cite the Q3 2026 edition
Prop971 Research (2026), Real Estate Market Balance: Dubai and Abu Dhabi, Q3 2026. Dubai residential sales volume and value. https://www.prop971.com/research/q3-2026/dubai-residential-sales


