
Indicator · Q3 2026
Dubai market breadth and concentration
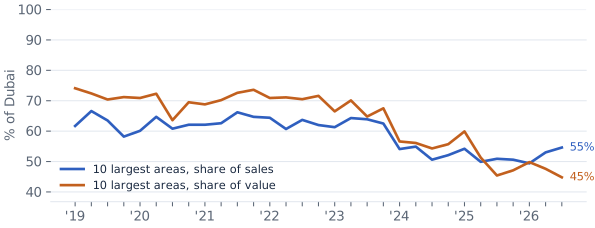
The 10 largest areas took 54.6% of Dubai's residential sales in Q3 2026, against 50.9% a year earlier. Sales were spread as if across 20 equal-sized areas, from 26.
Charts
Share of Dubai residential sales and value in the 10 largest areas, 2019 to Q3 2026
Data
Concentration of Dubai residential sales by quarter
| Quarter | Top 5 areas, share of sales | Top 10 areas, share of sales | Top 10 areas, share of value | Herfindahl index | Effective number of areas |
|---|---|---|---|---|---|
| Q3 2026 | 39.5% | 54.6% | 44.8% | 504 | 19.8 |
| Q2 2026 | 37.5% | 53.0% | 47.6% | 490 | 20.4 |
| Q1 2026 | 32.3% | 49.4% | 49.8% | 350 | 28.6 |
| Q4 2025 | 30.0% | 50.6% | 47.1% | 358 | 27.9 |
| Q3 2025 | 33.1% | 50.9% | 45.4% | 392 | 25.5 |
| Q2 2025 | 33.0% | 49.9% | 51.3% | 391 | 25.6 |
| Q1 2025 | 38.7% | 54.2% | 59.9% | 431 | 23.2 |
| Q4 2024 | 35.2% | 52.1% | 55.7% | 403 | 24.8 |
| Q3 2024 | 31.0% | 50.6% | 54.3% | 377 | 26.5 |
| Q2 2024 | 35.4% | 54.9% | 56.1% | 432 | 23.1 |
| Q1 2024 | 37.4% | 54.1% | 56.6% | 446 | 22.4 |
| Q4 2023 | 44.1% | 62.5% | 67.5% | 557 | 18.0 |
| Q3 2023 | 44.0% | 63.9% | 64.8% | 543 | 18.4 |
| Q2 2023 | 41.0% | 64.3% | 70.1% | 552 | 18.1 |
| Q1 2023 | 41.0% | 61.3% | 66.5% | 512 | 19.5 |
| Q4 2022 | 43.8% | 62.0% | 71.6% | 523 | 19.1 |
| Q3 2022 | 41.1% | 63.7% | 70.5% | 525 | 19.0 |
| Q2 2022 | 42.2% | 60.7% | 71.1% | 509 | 19.6 |
| Q1 2022 | 43.1% | 64.4% | 70.9% | 541 | 18.5 |
| Q4 2021 | 43.5% | 64.7% | 73.6% | 566 | 17.7 |
| Q3 2021 | 43.4% | 66.2% | 72.6% | 559 | 17.9 |
| Q2 2021 | 41.2% | 62.6% | 70.2% | 521 | 19.2 |
| Q1 2021 | 40.9% | 62.1% | 68.8% | 508 | 19.7 |
| Q4 2020 | 41.5% | 62.1% | 69.5% | 527 | 19.0 |
| Q3 2020 | 38.8% | 60.8% | 63.6% | 490 | 20.4 |
| Q2 2020 | 43.4% | 64.7% | 72.3% | 565 | 17.7 |
| Q1 2020 | 38.6% | 60.1% | 70.9% | 486 | 20.6 |
| Q4 2019 | 38.1% | 58.2% | 71.2% | 457 | 21.9 |
| Q3 2019 | 40.7% | 63.5% | 70.4% | 517 | 19.3 |
| Q2 2019 | 41.5% | 66.6% | 72.4% | 536 | 18.7 |
| Q1 2019 | 39.8% | 61.7% | 74.1% | 541 | 18.5 |
Definition and method
Shares of residential sales (count) and of sales value (AED) in the 5, 10 and 20 areas with the most activity in the quarter; HHI is the sum of squared area shares (x10,000); effective areas = 1/HHI. Each project is placed in the official land district it was registered under before 13 Feb 2026 (its most frequent label); sales after that date inherit the project's district even where the source now carries a community label. Market names are shown where the district maps 1:1 to one.
Areas are registered land districts; since 13 February 2026 DLD labels many sales with community names, which this series maps back so the basis stays the same over time.
Sources
- Dubai Land Department (DLD) open transaction data, Prop971 analysis
Cite
Cite the Q3 2026 edition
Prop971 Research (2026), Real Estate Market Balance: Dubai and Abu Dhabi, Q3 2026. Dubai market breadth and concentration. https://www.prop971.com/research/q3-2026/dubai-market-concentration


