Quarterly report · Issue 01 · Q3 2026

Real Estate Market Balance: Dubai and Abu Dhabi, Q3 2026

Six findings from the registered data for the third quarter of 2026: transactions, prices, rents, supply, breadth and financing in Dubai and Abu Dhabi, scored on the Prop971 Market Balance Index.

Published 9 October 2026 · Transaction data to 4 October 2026 · 38 pages · Methodology v1.0

Prop971 Market Balance Index · Q3 2026

0 to 100, 50 = neutral on every component. Abu Dhabi provisional. How the index is built →

01

Key findings

1
Observed

Prices held while activity normalised from a record year.

The median registered price was AED 1,685 per sq ft, -2.0% on Q3 2025 and +76% above Q3 2019. 32,385 homes changed hands, -35.8% on Q3 2025 but more than in 21 of the 30 earlier quarters since 2019.

2
Derived

Rental income held up while new-lease rents eased.

Registered apartment rents rose 5.0% over the 12 months to 30 Sep 2026. In Q3 2026 renewals carried a median of AED 64,000, +6.7% on Q1, while new contracts eased to AED 73,000 (-2.7%), with the all-contract medians of the largest established apartment districts lower than in Q1. Indicative gross yields are 7.3% for studios and 5.7% for one-bedroom apartments against a 3-month EIBOR of 4.32%.

3
Interpreted

The market widened at the entry level.

43% of sales were priced under AED 1m (28% a year earlier) and 73% were off-plan. Dubai South alone recorded 5,148 sales. The choice of new, lower-ticket homes for first-time buyers and smaller investors is wider than a year ago.

4
Derived

Supply is large, and most of it is in projects less than a quarter built.

An estimated 368,502 units remain to be built in 1,559 active projects, 2.35 times the past year’s sales. 78% of them sit in projects less than a quarter built; only 6,896 are in projects more than three-quarters complete.

5
Observed

Demand fundamentals kept growing in both emirates.

Dubai added 72,294 residents in the quarter, taking the population to 4.81 million by 7 October. Abu Dhabi’s residential sales value rose 31.1% to AED 27.4bn on 7.8% fewer deals; ADREC’s Abu Dhabi City sale price index was +17.3% y/y in August 2026.

6
Derived

Market balance: Dubai 44, Abu Dhabi 59 (provisional).

On the 0-100 Prop971 scale Dubai reads 6 points below neutral: market breadth (67), rental momentum (67) and financing environment (57) hold it up, transaction momentum (0), supply pressure (41) and price momentum (45) pull it down. Abu Dhabi reads firmer on price and rental momentum.

Observed = what registry records show. Derived = a Prop971 calculation from them. Interpreted = our reading, never a forecast.

02

Exhibits

FIG. 01

Prop971 Market Balance Index components for Dubai, Q3 2026: index 44
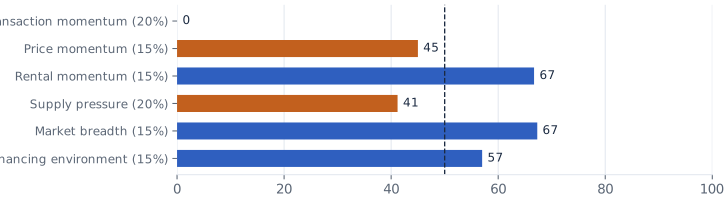
Prop971 Market Balance Index components for Dubai, Q3 2026: index 44
Swipe sideways to see the whole chart.
Source: Prop971 Research, Q3 2026. Reuse with attribution.

Full table, definition and source: Dubai Market Balance Index

FIG. 02

Quarterly residential sales in Dubai, 2019 to Q3 2026
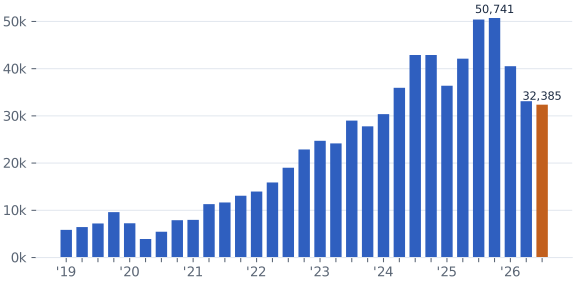
Quarterly residential sales in Dubai, 2019 to Q3 2026
Swipe sideways to see the whole chart.
Source: Prop971 Research, Q3 2026. Reuse with attribution.

Full table, definition and source: Dubai residential sales volume and value

FIG. 03

Median registered price per sq ft in Dubai by quarter, 2019 to Q3 2026
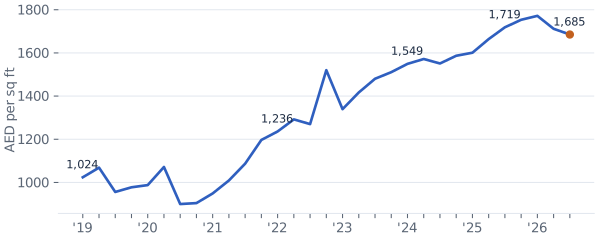
Median registered price per sq ft in Dubai by quarter, 2019 to Q3 2026
Swipe sideways to see the whole chart.
Source: Prop971 Research, Q3 2026. Reuse with attribution.

Full table, definition and source: Dubai median price per sq ft

FIG. 04

Dubai supply maturity ladder: estimated remaining units by construction stage
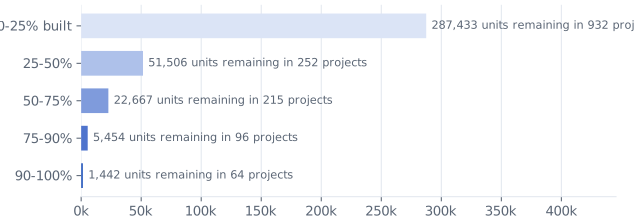
Dubai supply maturity ladder: estimated remaining units by construction stage
Swipe sideways to see the whole chart.
Source: Prop971 Research, Q3 2026. Reuse with attribution.

Full table, definition and source: Dubai residential supply pipeline

FIG. 05

Indicative gross apartment yield by bedroom count against the 3-month EIBOR
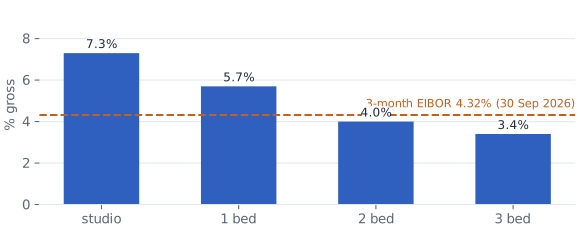
Indicative gross apartment yield by bedroom count against the 3-month EIBOR
Swipe sideways to see the whole chart.
Source: Prop971 Research, Q3 2026. Reuse with attribution.

Full table, definition and source: Dubai rents and gross rental yields

FIG. 06

Quarterly residential sales in Abu Dhabi, 2019 to Q3 2026
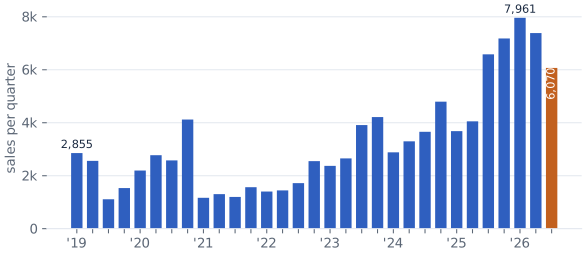
Quarterly residential sales in Abu Dhabi, 2019 to Q3 2026
Swipe sideways to see the whole chart.
Source: Prop971 Research, Q3 2026. Reuse with attribution.

Full table, definition and source: Abu Dhabi residential sales volume and value

FIG. 07

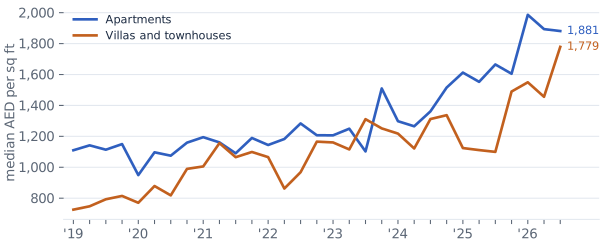
Median price per sq ft for Abu Dhabi apartments and villas by quarter, 2019 to Q3 2026

Median price per sq ft for Abu Dhabi apartments and villas by quarter, 2019 to Q3 2026
Swipe sideways to see the whole chart.
Source: Prop971 Research, Q3 2026. Reuse with attribution.

Full table, definition and source: Abu Dhabi median price per sq ft

03

Ten numbers to quote

Media kit
0132,385registered residential sales in Dubai in Q3 2026-35.8% on Q3 2025; higher than 21 of the 30 quarters since 2019
02AED 56.0bnof residential sales value in Dubai in the quarter-44.7% on Q3 2025; AED 217bn in the first nine months of 2026
03AED 1,685median registered price per sq ft in Dubai-2.0% on Q3 2025; +76% on Q3 2019
0473%of Dubai sales were off-plan, 70% of value77% and 79% a year earlier
0543%of Dubai sales were priced under AED 1 million28% a year earlier; sales above AED 5m were 3.6% of deals and 22% of value
06368,502estimated unfinished units in registered Dubai projects494,269 registered units in 1,559 active projects; 78% in projects under a quarter built
072.35xpipeline-to-absorption ratio for Dubairemaining units to sales in the 12 months to 30 Sep 2026; across the 12 largest pipelines, from 1.9x in Jumeirah Village Circle to 3.8x in Al Yelayiss 1
08+5.0%change in the median Dubai apartment rent over 12 monthsQ3 2026 contracts: median AED 68,000, new AED 73,000 vs renewed AED 64,000
09AED 27.4bnof residential sales value in Abu Dhabi in Q3 2026+31.1% on Q3 2025 from 6,070 sales (-7.8%); ADREC Abu Dhabi City sale index +17.3% y/y
1044 / 59Prop971 Market Balance Index, Dubai / Abu Dhabisix components, 50 = neutral; Abu Dhabi provisional. Dubai: transaction momentum 0, rental momentum 67
05

Cite and share

Cite this report

Prop971 Research (2026), Real Estate Market Balance: Dubai and Abu Dhabi, Q3 2026, Prop971, Dubai, published 9 October 2026, https://www.prop971.com/research/reports/market-balance-q3-2026

Charts, tables and figures may be reproduced with attribution to Prop971 Research and a link to www.prop971.com.

Share this report

Contact via WhatsApp