
Indicator · Q3 2026
Abu Dhabi residential sales volume and value
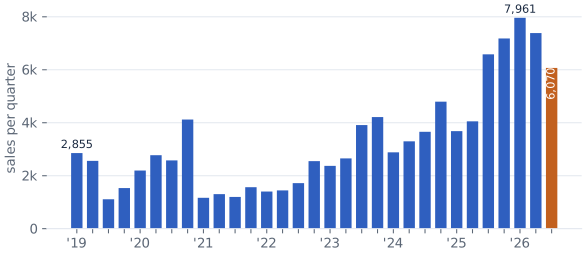
Abu Dhabi registered 21,416 home sales worth AED 95.8bn from January to September 2026, 3.3 times the count and 9.0 times the value of the same months of 2019. Nine months of 2026 already carry more value than any full year since 2019 (the previous high was AED 69.6bn in 2025); the busiest quarter on record was Q1 2026 with 7,961 sales.
Charts
Quarterly residential sales in Abu Dhabi, 2019 to Q3 2026
Data
Abu Dhabi residential sales by quarter
| Quarter | Sales | Value (AED bn) | Median price (AED m) |
|---|---|---|---|
| Q3 2026 | 6,070 | 27.4 | 2.76 |
| Q2 2026 | 7,385 | 30.2 | 2.41 |
| Q1 2026 | 7,961 | 38.2 | 2.59 |
| Q4 2025 | 7,181 | 24.0 | 2.36 |
| Q3 2025 | 6,582 | 20.9 | 2.13 |
| Q2 2025 | 4,053 | 12.2 | 2.10 |
| Q1 2025 | 3,682 | 12.4 | 1.99 |
| Q4 2024 | 4,795 | 16.7 | 2.05 |
| Q3 2024 | 3,658 | 10.1 | 1.81 |
| Q2 2024 | 3,299 | 8.0 | 1.46 |
| Q1 2024 | 2,884 | 9.0 | 1.58 |
| Q4 2023 | 4,214 | 13.2 | 1.86 |
| Q3 2023 | 3,911 | 13.4 | 1.83 |
| Q2 2023 | 2,653 | 6.1 | 1.68 |
| Q1 2023 | 2,372 | 7.5 | 2.28 |
| Q4 2022 | 2,550 | 6.8 | 2.16 |
| Q3 2022 | 1,721 | 4.2 | 1.68 |
| Q2 2022 | 1,446 | 3.1 | 1.57 |
| Q1 2022 | 1,404 | 3.0 | 1.41 |
| Q4 2021 | 1,567 | 3.0 | 1.30 |
| Q3 2021 | 1,198 | 2.6 | 1.58 |
| Q2 2021 | 1,305 | 3.2 | 1.91 |
| Q1 2021 | 1,166 | 2.2 | 1.37 |
| Q4 2020 | 4,122 | 7.1 | 1.38 |
| Q3 2020 | 2,578 | 4.8 | 1.37 |
| Q2 2020 | 2,775 | 4.7 | 1.33 |
| Q1 2020 | 2,195 | 4.1 | 1.21 |
| Q4 2019 | 1,533 | 2.9 | 1.37 |
| Q3 2019 | 1,112 | 2.5 | 1.53 |
| Q2 2019 | 2,561 | 4.1 | 1.22 |
| Q1 2019 | 2,855 | 4.1 | 1.16 |
Abu Dhabi residential sales by year (January to September, and full year)
| Year | Sales, Jan-Sep | Value Jan-Sep (AED bn) | Median price Jan-Sep (AED m) | Sales, full year | Value, full year (AED bn) |
|---|---|---|---|---|---|
| 2026 | 21,416 | 95.8 | 2.56 | ||
| 2025 | 14,317 | 45.5 | 2.09 | 21,498 | 69.6 |
| 2024 | 9,841 | 27.1 | 1.62 | 14,636 | 43.8 |
| 2023 | 8,936 | 27.0 | 1.89 | 13,150 | 40.2 |
| 2022 | 4,571 | 10.3 | 1.57 | 7,121 | 17.1 |
| 2021 | 3,669 | 8.0 | 1.63 | 5,236 | 11.0 |
| 2020 | 7,548 | 13.7 | 1.30 | 11,670 | 20.8 |
| 2019 | 6,528 | 10.7 | 1.22 | 8,061 | 13.6 |
Definition and method
Registered residential sales from ADREC's transaction-level sales export: apartments, duplexes, penthouses, villas and townhouses; court-mandated sales excluded. Medians use full-share sales with a recorded floor area, a price above AED 50,000 and AED 100 to 30,000 per sq ft.
ADREC's dashboard financing tally counts a different number of home sales per year (7,713 in 2020 against 11,670 here); this series uses the transaction-level export on one basis for every year. Year-end registration peaks make single quarters lumpy.
Sources
- Abu Dhabi Real Estate Centre (ADREC) registered sales export, Prop971 analysis
Cite
Cite the Q3 2026 edition
Prop971 Research (2026), Real Estate Market Balance: Dubai and Abu Dhabi, Q3 2026. Abu Dhabi residential sales volume and value. https://www.prop971.com/research/q3-2026/abu-dhabi-residential-sales


