
Indicator · Q3 2026
Abu Dhabi home sales by area
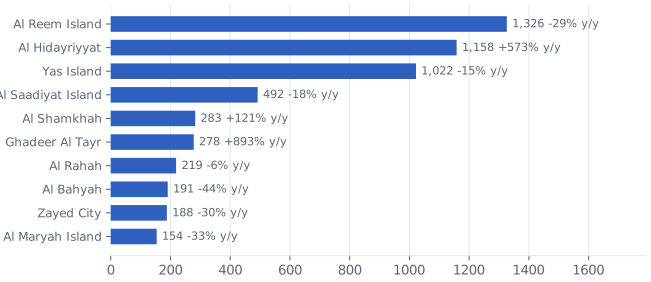
Al Reem Island, Al Hidayriyyat and Yas Island took 22%, 19% and 17% of Abu Dhabi's 6,070 home sales in Q3 2026; the 10 largest areas took 87.5%. Al Hidayriyyat, Zayed City and Al Shamkhah had almost no registered home sales in 2019 and together took 21% of sales from January to September 2026.
Charts
The 10 Abu Dhabi areas with the most residential sales, Q3 2026
Data
The 10 areas with the most residential sales, Q3 2026
| Area | Sales | Share of sales | Sales y/y | Share of value | Off-plan share | Median AED per sq ft | AED per sq ft y/y |
|---|---|---|---|---|---|---|---|
| Al Reem Island | 1,326 | 21.8% | -29% | 11.3% | 76% | 1,643 | +12% |
| Al Hidayriyyat | 1,158 | 19.1% | +573% | 34.1% | 100% | 1,924 | +16% |
| Yas Island | 1,022 | 16.8% | -15% | 9.3% | 85% | 2,337 | +36% |
| Al Saadiyat Island | 492 | 8.1% | -18% | 13.0% | 73% | 2,425 | +3% |
| Al Shamkhah | 283 | 4.7% | +121% | 2.0% | 63% | 1,181 | +11% |
| Ghadeer Al Tayr | 278 | 4.6% | +893% | 4.2% | 99% | 1,695 | n/a |
| Al Rahah | 219 | 3.6% | -6% | 2.4% | 65% | 2,150 | +40% |
| Al Bahyah | 191 | 3.1% | -44% | 2.2% | 98% | 465 | +0% |
| Zayed City | 188 | 3.1% | -30% | 1.8% | 88% | 1,573 | +12% |
| Al Maryah Island | 154 | 2.5% | -33% | 2.2% | 89% | 1,975 | +44% |
Share of each year's sales (January to September) in the 8 areas with the most sales in 2026
| Area | 2019 | 2020 | 2021 | 2022 | 2023 | 2024 | 2025 | 2026 |
|---|---|---|---|---|---|---|---|---|
| Al Reem Island | 37.3% | 16.7% | 30.5% | 21.2% | 25.0% | 23.2% | 24.1% | 27.5% |
| Yas Island | 18.2% | 13.0% | 27.0% | 29.0% | 21.6% | 25.2% | 19.4% | 19.0% |
| Al Hidayriyyat | 0.0% | 0.0% | 0.0% | 0.0% | 0.0% | 0.0% | 3.5% | 13.7% |
| Al Saadiyat Island | 1.6% | 7.5% | 7.4% | 11.6% | 13.6% | 16.6% | 13.4% | 8.8% |
| Zayed City | 0.0% | 0.0% | 0.0% | 0.7% | 5.3% | 8.4% | 3.4% | 3.7% |
| Al Rahah | 2.1% | 1.9% | 6.2% | 5.6% | 2.7% | 3.1% | 4.0% | 3.6% |
| Khalifa City | 3.4% | 6.4% | 4.6% | 4.9% | 4.6% | 4.4% | 3.8% | 3.5% |
| Al Shamkhah | 0.1% | 0.3% | 0.2% | 5.1% | 8.9% | 5.9% | 1.7% | 3.5% |
| These 8 areas | 62.7% | 45.8% | 75.9% | 78.1% | 81.7% | 86.8% | 73.3% | 83.3% |
| Areas with a sale | 55 | 69 | 71 | 73 | 74 | 79 | 80 | 84 |
Definition and method
Areas are ADREC registered districts. Registered residential sales from ADREC's transaction-level sales export: apartments, duplexes, penthouses, villas and townhouses; court-mandated sales excluded. Medians use full-share sales with a recorded floor area, a price above AED 50,000 and AED 100 to 30,000 per sq ft.
Price changes by area are shown only where both quarters have at least 100 cleaned sales; launch-area medians move with what sold.
Sources
- Abu Dhabi Real Estate Centre (ADREC) registered sales export, Prop971 analysis
Cite
Cite the Q3 2026 edition
Prop971 Research (2026), Real Estate Market Balance: Dubai and Abu Dhabi, Q3 2026. Abu Dhabi home sales by area. https://www.prop971.com/research/q3-2026/abu-dhabi-sales-by-area


