
Indicator · Q3 2026
Abu Dhabi property market overview
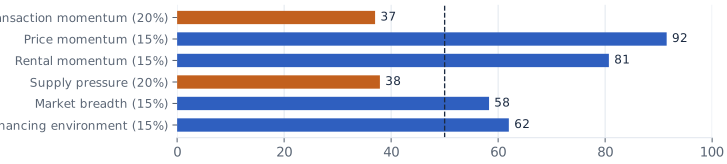
Abu Dhabi registered 6,070 residential sales in Q3 2026 (-7.8% y/y) worth AED 27.4bn (+31.1%), at a median of AED 1,837 per sq ft (+16.6%). On the same six components as Dubai, the provisional Prop971 Market Balance Index reads 59: price momentum and rental momentum hold it up.
Charts
Provisional Prop971 Market Balance Index components for Abu Dhabi, Q3 2026: index 59
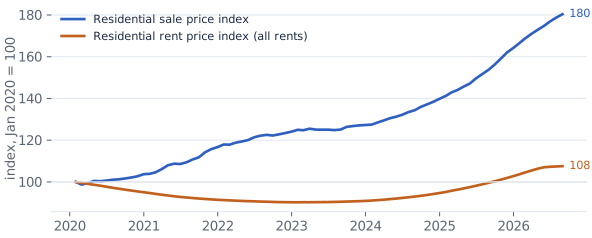
ADREC residential sale and rent price indices, Abu Dhabi City
Data
Provisional index components, Abu Dhabi, Q3 2026
| Component | Weight | Input | What the input is | Scale | Score |
|---|---|---|---|---|---|
| Transaction momentum | 20% | -7.8% | Residential sales, Q3 2026 vs Q3 2025 (ADREC registered sales) | -30% = 0, 0% = 50, +30% = 100 | 37 |
| Price momentum | 15% | +16.6% | Median AED/sq ft, Q3 2026 vs Q3 2025 | -20% = 0, 0% = 50, +20% = 100 | 92 |
| Rental momentum | 15% | +9.2% | ADREC residential rent price index, apartments, Aug 2026 vs a year earlier | -15% = 0, 0% = 50, +15% = 100 | 81 |
| Supply pressure | 20% | 2.48x | ADREC projected additional units to 2030 / sales in the 12 months to 30 Sep 2026 | 4.0x = 0, 2.0x = 50, 0 = 100 | 38 |
| Market breadth | 15% | 12.5% | Share of sales outside the 10 largest areas, Q3 2026 | -5.0% = 0, 10.0% (Q4 2024 to Q4 2025 average) = 50, 25.0% = 100 | 58 |
| Financing environment | 15% | +1.5pp | Median indicative gross apartment yield across districts and layouts (5.8%, ADREC dashboard averages, Q3 2026) minus 3-month EIBOR (4.32%) | -1pp = 0, +1pp = 50, +3pp = 100 | 62 |
| Prop971 Market Balance Index (provisional) | 100% | Weighted average of the six scores | 0-100, 50 = neutral | 58.9 |
Abu Dhabi residential sales, last eight quarters
| Quarter | Sales | Value (AED bn) | Median price (AED m) | Median AED per sq ft | Off-plan, share of sales |
|---|---|---|---|---|---|
| Q3 2026 | 6,070 | 27.4 | 2.76 | 1,837 | 80% |
| Q2 2026 | 7,385 | 30.2 | 2.41 | 1,842 | 83% |
| Q1 2026 | 7,961 | 38.2 | 2.59 | 1,887 | 81% |
| Q4 2025 | 7,181 | 24.0 | 2.36 | 1,547 | 76% |
| Q3 2025 | 6,582 | 20.9 | 2.13 | 1,575 | 71% |
| Q2 2025 | 4,053 | 12.2 | 2.10 | 1,424 | 59% |
| Q1 2025 | 3,682 | 12.4 | 1.99 | 1,434 | 64% |
| Q4 2024 | 4,795 | 16.7 | 2.05 | 1,386 | 67% |
Definition and method
Prop971 Market Balance Index v1.0: weighted average of six component scores (0 to 100), each a linear scale of a published input with the bounds stated. Higher = firmer market conditions on balance; 50 = neutral. Abu Dhabi: supply pressure uses ADREC's projected additional units to 2030, rental momentum ADREC's rent price index for apartments.
Provisional: one input is an ADREC projection rather than registered records, and breadth is scored against a Q4 2024 to Q4 2025 average. ADREC price indices run to August 2026.
Sources
- Abu Dhabi Real Estate Centre (ADREC) registered sales export, Prop971 analysis
- ADREC dashboard: price indices, rents, lease value, financing
- ADREC H1 2026 market report (stock and pipeline)
- Central Bank of the UAE (EIBOR)
Cite
Cite the Q3 2026 edition
Prop971 Research (2026), Real Estate Market Balance: Dubai and Abu Dhabi, Q3 2026. Abu Dhabi property market overview. https://www.prop971.com/research/q3-2026/abu-dhabi-residential-market


