
Indicator · Q3 2026
Abu Dhabi median price per sq ft
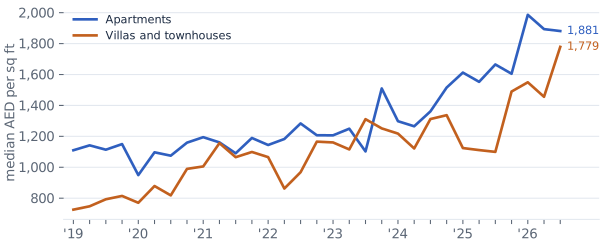
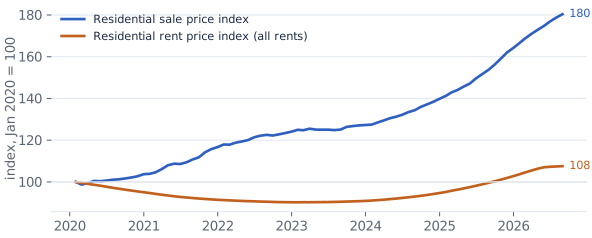
The median registered Abu Dhabi home sold for AED 1,837 per sq ft in Q3 2026, +16.6% on Q3 2025: apartments AED 1,881, villas and townhouses AED 1,779. From January to September 2019 to the same months of 2026 the apartment median rose +68% and the villa median +109%. ADREC's mix-controlled sale price index for Abu Dhabi City was +17.3% y/y.
Charts
Median price per sq ft for Abu Dhabi apartments and villas by quarter, 2019 to Q3 2026
ADREC residential sale and rent price indices, Abu Dhabi City
Data
Median price per sq ft by quarter (AED)
| Quarter | All homes | Apartments | Villas and townhouses |
|---|---|---|---|
| Q3 2026 | 1,837 | 1,881 | 1,779 |
| Q2 2026 | 1,842 | 1,894 | 1,456 |
| Q1 2026 | 1,887 | 1,986 | 1,550 |
| Q4 2025 | 1,547 | 1,605 | 1,490 |
| Q3 2025 | 1,575 | 1,665 | 1,100 |
| Q2 2025 | 1,424 | 1,553 | 1,111 |
| Q1 2025 | 1,434 | 1,612 | 1,124 |
| Q4 2024 | 1,386 | 1,516 | 1,337 |
| Q3 2024 | 1,317 | 1,361 | 1,312 |
| Q2 2024 | 1,230 | 1,265 | 1,122 |
| Q1 2024 | 1,262 | 1,298 | 1,218 |
| Q4 2023 | 1,331 | 1,510 | 1,251 |
| Q3 2023 | 1,212 | 1,103 | 1,311 |
| Q2 2023 | 1,183 | 1,250 | 1,115 |
| Q1 2023 | 1,183 | 1,207 | 1,161 |
| Q4 2022 | 1,176 | 1,207 | 1,166 |
| Q3 2022 | 1,187 | 1,284 | 968 |
| Q2 2022 | 1,077 | 1,183 | 862 |
| Q1 2022 | 1,127 | 1,144 | 1,066 |
| Q4 2021 | 1,153 | 1,190 | 1,099 |
| Q3 2021 | 1,080 | 1,090 | 1,065 |
| Q2 2021 | 1,156 | 1,161 | 1,156 |
| Q1 2021 | 1,089 | 1,195 | 1,006 |
| Q4 2020 | 1,062 | 1,159 | 990 |
| Q3 2020 | 942 | 1,075 | 818 |
| Q2 2020 | 1,019 | 1,097 | 879 |
| Q1 2020 | 829 | 949 | 770 |
| Q4 2019 | 976 | 1,150 | 815 |
| Q3 2019 | 903 | 1,114 | 793 |
| Q2 2019 | 1,093 | 1,142 | 748 |
| Q1 2019 | 957 | 1,110 | 726 |
Median price per sq ft by year, January to September (AED)
| Year | Apartments | Apartment sales measured | Villas and townhouses | Villa and townhouse sales measured |
|---|---|---|---|---|
| 2026 | 1,916 | 15,255 | 1,563 | 5,686 |
| 2025 | 1,631 | 10,535 | 1,112 | 3,558 |
| 2024 | 1,287 | 6,805 | 1,223 | 2,760 |
| 2023 | 1,185 | 4,621 | 1,203 | 4,083 |
| 2022 | 1,212 | 2,961 | 934 | 1,491 |
| 2021 | 1,142 | 2,102 | 1,091 | 1,440 |
| 2020 | 1,061 | 3,687 | 807 | 2,681 |
| 2019 | 1,139 | 4,333 | 747 | 1,801 |
Definition and method
Registered residential sales from ADREC's transaction-level sales export: apartments, duplexes, penthouses, villas and townhouses; court-mandated sales excluded. Medians use full-share sales with a recorded floor area, a price above AED 50,000 and AED 100 to 30,000 per sq ft.
Medians move with the mix of what sold; ADREC's indices control for mix. Villa and townhouse medians follow which communities launched.
Sources
- Abu Dhabi Real Estate Centre (ADREC) registered sales export, Prop971 analysis
- ADREC residential sale price index (dashboard export)
Cite
Cite the Q3 2026 edition
Prop971 Research (2026), Real Estate Market Balance: Dubai and Abu Dhabi, Q3 2026. Abu Dhabi median price per sq ft. https://www.prop971.com/research/q3-2026/abu-dhabi-price-per-sq-ft


