
Indicator · Q3 2026
Abu Dhabi rents and gross rental yields
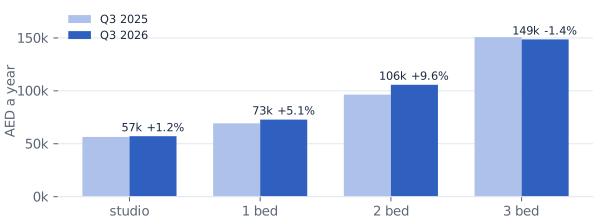
Across the 12 Abu Dhabi districts with the most sales, the median of ADREC's district average apartment rents was AED 72,853 a year for a one-bedroom (+5.1% y/y) and AED 105,709 for a two-bedroom (+9.6%) in Q3 2026. Indicative gross yields ran from 5.5% to 7.3% by layout, against a 3-month EIBOR of 4.32%.
Charts
Abu Dhabi apartment rent by layout against a year earlier
Data
Apartments by layout, Q3 2026
| Layout | Median of district average rents (AED a year) | Y/y | Districts | Indicative gross yield | Districts with a sale price |
|---|---|---|---|---|---|
| studio | 57,143 | +1.2% | 8 | 7.3% | 6 |
| 1 bed | 72,853 | +5.1% | 8 | 6.2% | 6 |
| 2 beds | 105,709 | +9.6% | 9 | 5.7% | 6 |
| 3 beds | 148,587 | -1.4% | 7 | 5.5% | 4 |
Districts with a published rent and sale price, Q3 2026
| District | 1-bed rent (AED) | 1-bed y/y | 1-bed yield | 2-bed rent (AED) | 2-bed y/y | 2-bed yield |
|---|---|---|---|---|---|---|
| Al Reem Island | 76,230 | +10.1% | 6.2% | 105,709 | +9.6% | 5.8% |
| Yas Island | 89,156 | +2.0% | 6.2% | 126,778 | +10.2% | 5.7% |
| Al Saadiyat Island | 84,029 | +4.4% | 5.5% | 151,780 | +5.2% | 5.7% |
| Khalifa City | 58,301 | -2.3% | 6.4% | 93,493 | -0.3% | 7.4% |
| Al Rahah | 69,476 | +0.0% | 4.5% | 108,724 | +2.9% | 4.8% |
| Al Maryah Island | 87,418 | +2.2% | 8.3% | 237,486 | -4.3% | 3.3% |
Definition and method
Rents are ADREC's published quarterly district averages (all contracts, renewals included), taken over the 12 districts with the most registered sales in the past year. Indicative gross yield = ADREC average annual rent / ADREC average sale price for the same district and layout, where both are published. Not a property-level return: no costs, vacancy or financing.
In the district table, districts whose average rent swung more than 30% in a year are left out as sample artefacts; the layout medians use every district with a published rent.
Sources
- ADREC dashboard, residential rent and sale prices by area (export of 7 Oct 2026)
- Central Bank of the UAE (EIBOR)
Cite
Cite the Q3 2026 edition
Prop971 Research (2026), Real Estate Market Balance: Dubai and Abu Dhabi, Q3 2026. Abu Dhabi rents and gross rental yields. https://www.prop971.com/research/q3-2026/abu-dhabi-rental-yields


