
Indicator · Q3 2026
Dubai rents and gross rental yields
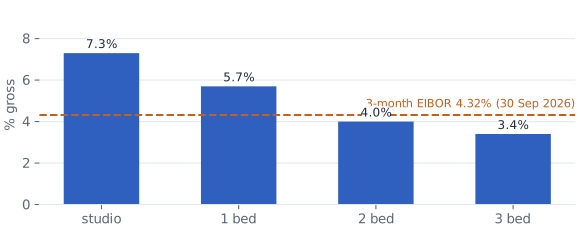
Registered apartment rents rose +5.0% over the 12 months to 30 September 2026. Indicative gross yields were 7.3% for studios, 5.7% for one-bedroom, 4.0% for two-bedroom and 3.4% for three-bedroom apartments, against a 3-month EIBOR of 4.32% on 30 September.
Charts
Indicative gross apartment yield by bedroom count against the 3-month EIBOR
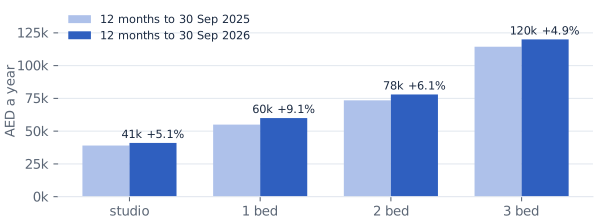
Median registered apartment rent by bedroom count, 12 months to 30 Sep 2026 vs prior year
Data
Apartments by bedroom count, 12 months to 30 Sep 2026
| Bedrooms | Median annual rent (AED) | Rent, 12m change | Leases | Median ready price (AED) | Gross yield |
|---|---|---|---|---|---|
| studio | 41,000 | +5.1% | 118,878 | 560,000 | 7.3% |
| 1 bed | 59,999 | +9.1% | 233,851 | 1,047,382 | 5.7% |
| 2 beds | 78,000 | +6.1% | 183,421 | 1,950,000 | 4.0% |
| 3 beds | 120,000 | +4.9% | 37,169 | 3,500,000 | 3.4% |
Apartment rents and yields by area
| Area | Median annual rent (AED) | Rent, 12m change | Median ready price (AED) | Gross yield | Leases | Sales |
|---|---|---|---|---|---|---|
| Dubai Investment Park Second | 62,000 | +19.2% | 579,873 | 10.7% | 4,716 | 213 |
| International City Phases 2 and 3 | 46,000 | +9.5% | 500,000 | 9.2% | 10,234 | 413 |
| International City Phase 1 | 38,000 | +5.6% | 420,000 | 9.0% | 26,421 | 1,270 |
| Dubai South | 65,000 | +8.3% | 750,000 | 8.7% | 7,040 | 859 |
| Dubai Land Residence Complex | 52,000 | +8.3% | 640,000 | 8.1% | 7,942 | 619 |
| Dubai Production City | 50,000 | +6.4% | 620,000 | 8.1% | 7,519 | 882 |
| Dubai Sports City | 50,400 | +5.0% | 663,468 | 7.6% | 8,837 | 1,157 |
| Dubai Silicon Oasis | 55,000 | +9.6% | 730,000 | 7.5% | 16,270 | 1,046 |
| Arjan | 62,000 | +3.3% | 840,000 | 7.4% | 14,117 | 1,283 |
| Jumeirah Village Circle | 65,000 | +0.0% | 950,000 | 6.8% | 29,807 | 4,203 |
| Liwan | 54,000 | +11.3% | 827,854 | 6.5% | 4,810 | 464 |
| Jumeirah Lakes Towers | 85,000 | +0.0% | 1,337,500 | 6.4% | 8,571 | 908 |
| Business Bay | 95,000 | -1.0% | 1,530,000 | 6.2% | 18,701 | 2,285 |
| Al Merkadh | 75,000 | +2.7% | 1,275,000 | 5.9% | 11,906 | 1,953 |
| Dubai Hills Estate | 110,000 | +7.8% | 1,850,000 | 5.9% | 5,495 | 983 |
| Al Jaddaf | 75,000 | +3.1% | 1,301,116 | 5.8% | 8,998 | 546 |
| Downtown Dubai | 144,570 | -1.0% | 2,725,000 | 5.3% | 9,779 | 1,600 |
| Dubai Creek Harbour | 130,000 | +0.0% | 2,460,000 | 5.3% | 6,068 | 1,232 |
| Al Furjan | 60,489 | +6.1% | 1,196,215 | 5.1% | 26,753 | 783 |
| Dubai Marina | 120,000 | -1.1% | 2,430,000 | 4.9% | 19,388 | 2,444 |
Definition and method
Registered residential leases (Ejari export of 6 Oct 2026), contracts starting in the 12 months to 30 Sep 2026 versus the 12 months before; annual rent between AED 5,000 and 5,000,000. Indicative gross rental yield = median registered annual rent / median registered ready (not off-plan) sale price for the same bedroom count, over the same 12 months. Not a property-level return: no costs, vacancy or financing.
Gross yield before service charges, vacancy and financing; an indicator, not a return calculation.
Sources
- DLD Ejari registered rent contracts
- Dubai Land Department (DLD) open transaction data, Prop971 analysis
- Central Bank of the UAE (EIBOR)
Cite
Cite the Q3 2026 edition
Prop971 Research (2026), Real Estate Market Balance: Dubai and Abu Dhabi, Q3 2026. Dubai rents and gross rental yields. https://www.prop971.com/research/q3-2026/dubai-rental-yields


