
In April 2026 the headline was that Dubai home prices fell for the first time since 2020. In the transaction register, April 2026 was the most expensive month for Dubai homes in two years of registered sales. Both statements are true, and the gap between them is worth understanding before it costs you a decision.
This article reads the register, not the headlines. The short version: Dubai home prices in the first half of 2026 came in at a median of AED 1,738 per square foot, 6.2% above the H1 2025 figure of AED 1,636. Of the 37 districts with real sales depth, 32 are above their year-ago price. July's median matched last July almost exactly. That is not a market falling. It is a market that sprinted through spring and walked through summer.
Where Dubai home prices stand right now
The monthly path tells the story better than any single number. The median climbed through late 2025, peaked at AED 1,826 per square foot in April 2026, and eased back to AED 1,700 by July, 0.2% below the July 2025 figure of AED 1,704.
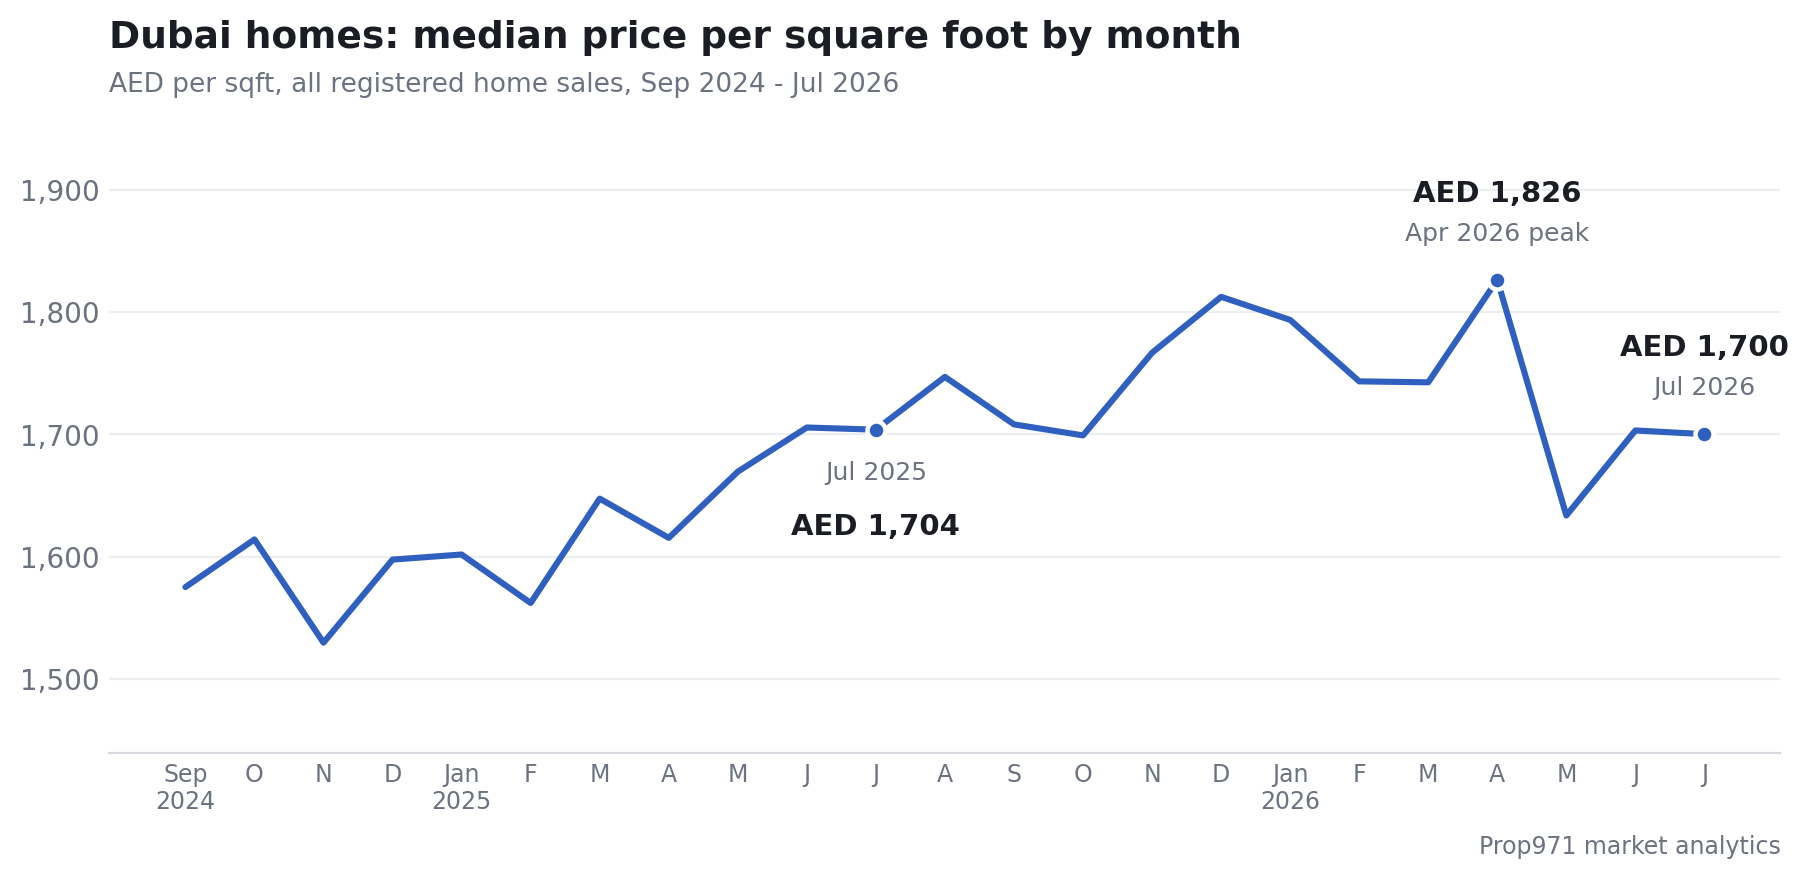
Two takeaways a buyer can act on. First, the half-year median is the number to anchor on, because single months swing with what happens to sell in them, and AED 1,738 is 6.2% above a year ago. Second, the summer settling means the gap between asking prices set in the spring and prices actually clearing now is where negotiation lives. A seller anchored to April is negotiating against a market that has moved back to July 2025 levels, and July 2025 was hardly a distressed market.
The Dubai housing market, segment by segment
Every major segment of the Dubai housing market sold for more in H1 2026 than in H1 2025. The spread between them is the useful part:
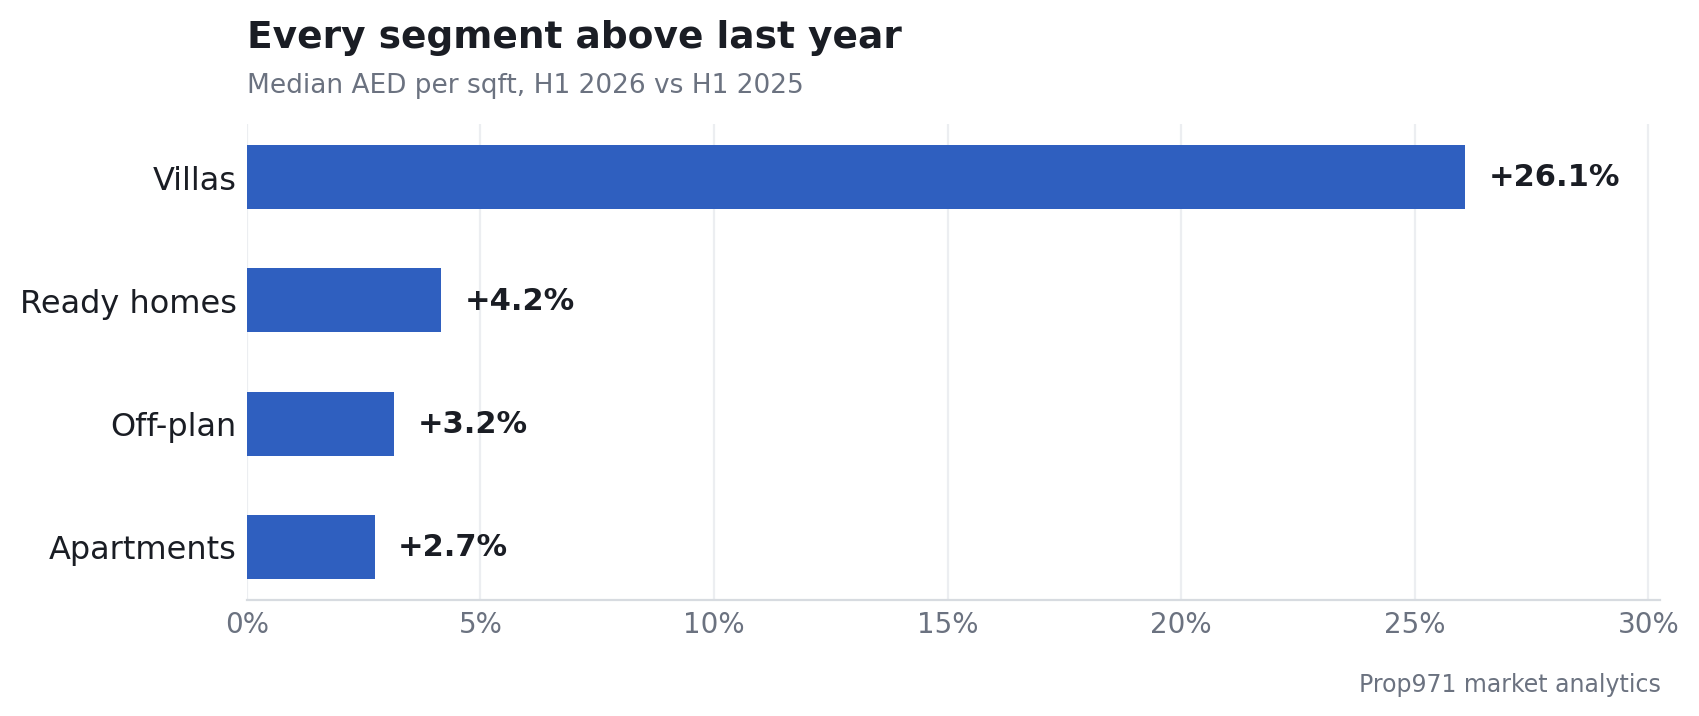
Apartments moved from AED 1,682 to AED 1,728 per square foot, a 2.7% rise. Finished, ready homes moved 4.2%, from AED 1,369 to AED 1,426. Off-plan moved 3.2%, from AED 1,751 to AED 1,806, which keeps the launch premium over ready stock at roughly 27%. The premium is the price of a payment plan and a delivery date, and it has barely moved in a year.
Villas are the outlier at +26.1%, from AED 1,445 to AED 1,822, and that number needs a caveat the others do not. Villa medians are the most mix-sensitive figure in the register, because a handful of communities handing over in a given half can move the median before a single existing villa reprices. Read the direction as real and the magnitude as partly composition.
What 37 districts say about the current real estate market in Dubai
The current real estate market in Dubai is not one market. Thirty-seven districts cleared at least 150 home sales in each of the last two first-halves, and 32 of them are above their year-ago price per square foot. Here are the ten busiest:
| District | Sales H1 2026 | Median AED/sqft | vs H1 2025 |
|---|---|---|---|
| Dubai South (Madinat Al Mataar) | 7,144 | AED 1,659 | -2.8% |
| Dubai Islands (Palm Deira) | 2,910 | AED 2,851 | +20.7% |
| Business Bay | 2,608 | AED 2,524 | +6.4% |
| Jabal Ali First | 2,186 | AED 1,590 | +22.1% |
| Dubai Creek Harbour (Al Khairan First) | 1,668 | AED 2,620 | +9.9% |
| Al Yelayiss 1 | 1,655 | AED 1,822 | +63.6% |
| Jumeirah Village Circle (Al Barsha South Fourth) | 1,518 | AED 1,478 | +2.9% |
| Wadi Al Safa 5 | 1,461 | AED 1,507 | +11.8% |
| Dubai Marina | 1,294 | AED 2,288 | -17.0% |
| Al Hebiah Fifth | 1,248 | AED 1,849 | +15.0% |
Registered home sales, H1 2026 vs H1 2025. Prop971 market analytics.
Sorted by sales count, not by growth, because depth is what makes a district median believable. One line under this table matters more than the table: a district median moves with what sold there, not only with repricing.
Dubai Marina is the worked example. Its blended median shows a 17% fall, and the blend is the whole story. Finished Marina homes actually resold 2.6% higher, at AED 1,893 per square foot against AED 1,846 a year earlier, and new Marina launches priced 28% higher than last year's launches. What changed is the mix: launches went from over half of Marina sales to 28% of them. Both halves of the market got more expensive, and the average went down.
So the test, whenever a district shows a startling move in either direction: check whether its sales volume and its launch share moved at the same time. Volume jumping alongside a jumping median is mix first, repricing second. Al Yelayiss 1 is the extreme case in the table: its +63.6% comes from a half in which sales went from 225 resales to 1,655 transactions that are 98% new launches. Nobody's existing villa there got 64% more valuable in twelve months; the register filled with newer, dearer stock. Same reading for Dubai Islands at +20.7%, where sales are entirely off-plan: launches pricing above earlier launches is a genuine signal about developer confidence, but a different signal than resale appreciation.
The April headlines vs the register
What fell in April was a monthly valuation index. What the register shows for the same month is the highest median of the past two years. There is no contradiction: a valuation index estimates the value of the standing stock month to month, while the register records the prices buyers actually paid, and every completed sale behind these figures is a transfer filed with the Dubai Land Department, with ADREC playing the same role in Abu Dhabi. Indexes lead sentiment. Registers settle arguments.
Sales pace is the honest place to look for cooling, and it is visible there: 69,621 homes changed hands in H1 2026, about 11% fewer than the exceptional first half of 2025. That is still a pace above 11,500 homes a month, which is not what a stalled market looks like.
The practical problem is that none of this is knowable from one month's reading, and one month's reading is what most coverage gives you. The series is the product. Our analytics dashboard charts these medians monthly, per district and per segment, so you can check whether the number you were quoted is a trend or a blip before you act on it.
UAE house prices beyond Dubai
UAE house prices are not one number either, and in H1 2026 Abu Dhabi's register ran hotter than Dubai's. The capital's median came in at AED 1,857 per square foot, 30% above H1 2025, on sales volume that nearly doubled from 7,599 to 15,030. Apply the same test as above: when volume doubles and the median jumps together, read mix before repricing. Abu Dhabi's first half is that pattern, a market whose centre of gravity moved up-market as more new stock transacted.
For investors the quieter number is yield. On finished Dubai stock in H1 2026, median rents against median prices put gross yields at about 7.0% for studios and 5.2% for one-beds. Prices rising 6% while smaller units still clear 7% gross is the combination that keeps buy-side demand coming back, and it is the number the price headlines never mention.
FAQ
Did Dubai home prices fall for the first time since 2020?
A monthly valuation index recorded its first month-on-month decline since 2020 in spring 2026, which is where the headline came from. Registered transaction medians tell a different story: H1 2026 came in 6.2% above H1 2025, and the April that made the headlines was the highest-priced month in two years of registered sales. A single soft month inside a rising half-year is normal market texture, not a turn.
How is the Dubai real estate market performing in 2026?
Solidly, by the numbers buyers actually paid: a median of AED 1,738 per square foot in H1 2026, up 6.2% on the year, with 32 of 37 deep districts above their year-ago level and 69,621 homes sold in six months. The pace is calmer than 2025's record first half, and calmer pace with rising medians is consolidation, not decline.
What is the price per square foot in Dubai in 2026?
The H1 2026 median across all registered home sales is AED 1,738 per square foot. Apartments sit at AED 1,728, villas at AED 1,822, ready homes at AED 1,426 and off-plan at AED 1,806. The villas versus apartments breakdown covers why those gaps exist and what they mean for a purchase decision.
What is the forecast for Dubai property prices?
Forecasting is a different exercise from measuring, and we keep them separate. The measured base going into H2 2026: medians 6.2% up on the year, July level with last July, and volumes running near 11,600 homes a month. Our full Dubai property market forecast works through the five numbers that will tell you first if the trend changes.
Which Dubai districts are rising fastest in 2026?
Setting aside moves so large they are clearly launch-mix, the fastest risers with at least 150 sales in both halves are Palm Jumeirah at +32.9%, Al Jadaf at +26.9% and Jabal Ali First at +22.1%, followed by a band of launch-heavy districts around +20%, including Dubai Islands and Al Satwa. For where growth translates into an investment case, see best areas to invest in Dubai.
References
Figures in this article are computed from official UAE property transaction records (DLD, ADREC) via Prop971 market analytics, including transactions up to 8 August 2026.


