
Every list of the best areas to invest in Dubai has the same problem: the word best is doing three different jobs. Best price growth, best rental yield and best liquidity are three different rankings, and no district in the UAE tops more than one of them.
That is not a technicality. Over the last twelve months the fastest-appreciating district we measured (Saadiyat Island, +35%) is not the best-yielding one (International City, 8.4% gross, prices up just 5%), and the most liquid one (Dubai South, over 14k sales) is neither. No district tops more than one of the three lists. Any article that hands you a single ranking has quietly picked one definition and hidden the other two.
So here are all three, measured the same way: median prices per square foot over matched twelve-month windows, only districts with at least 150 sales in each window, both emirates. Pick the column that matches what you actually want from the money.
First, decide which "best" you mean
A growth buyer wants the district repricing fastest. An income buyer wants the widest gap between rent and price. Most buyers claim to want both, and the data's core finding is blunt: growth and yield live in different districts. The places appreciating fastest pay the least rent per dirham invested, and the places that pay the most rent barely appreciate.
Which is how a famous district can be one of the best areas to invest in Dubai and a district where prices fell 10% last year, at the same time, depending on who is talking. Best!
Three numbers define any district, and all three appear below: what prices did year on year, what the rent pays as a share of the price, and how many times the district actually traded.
The best areas in Dubai to invest for price growth
Measured on the median price per square foot, twelve months to late August 2026 against the twelve before:
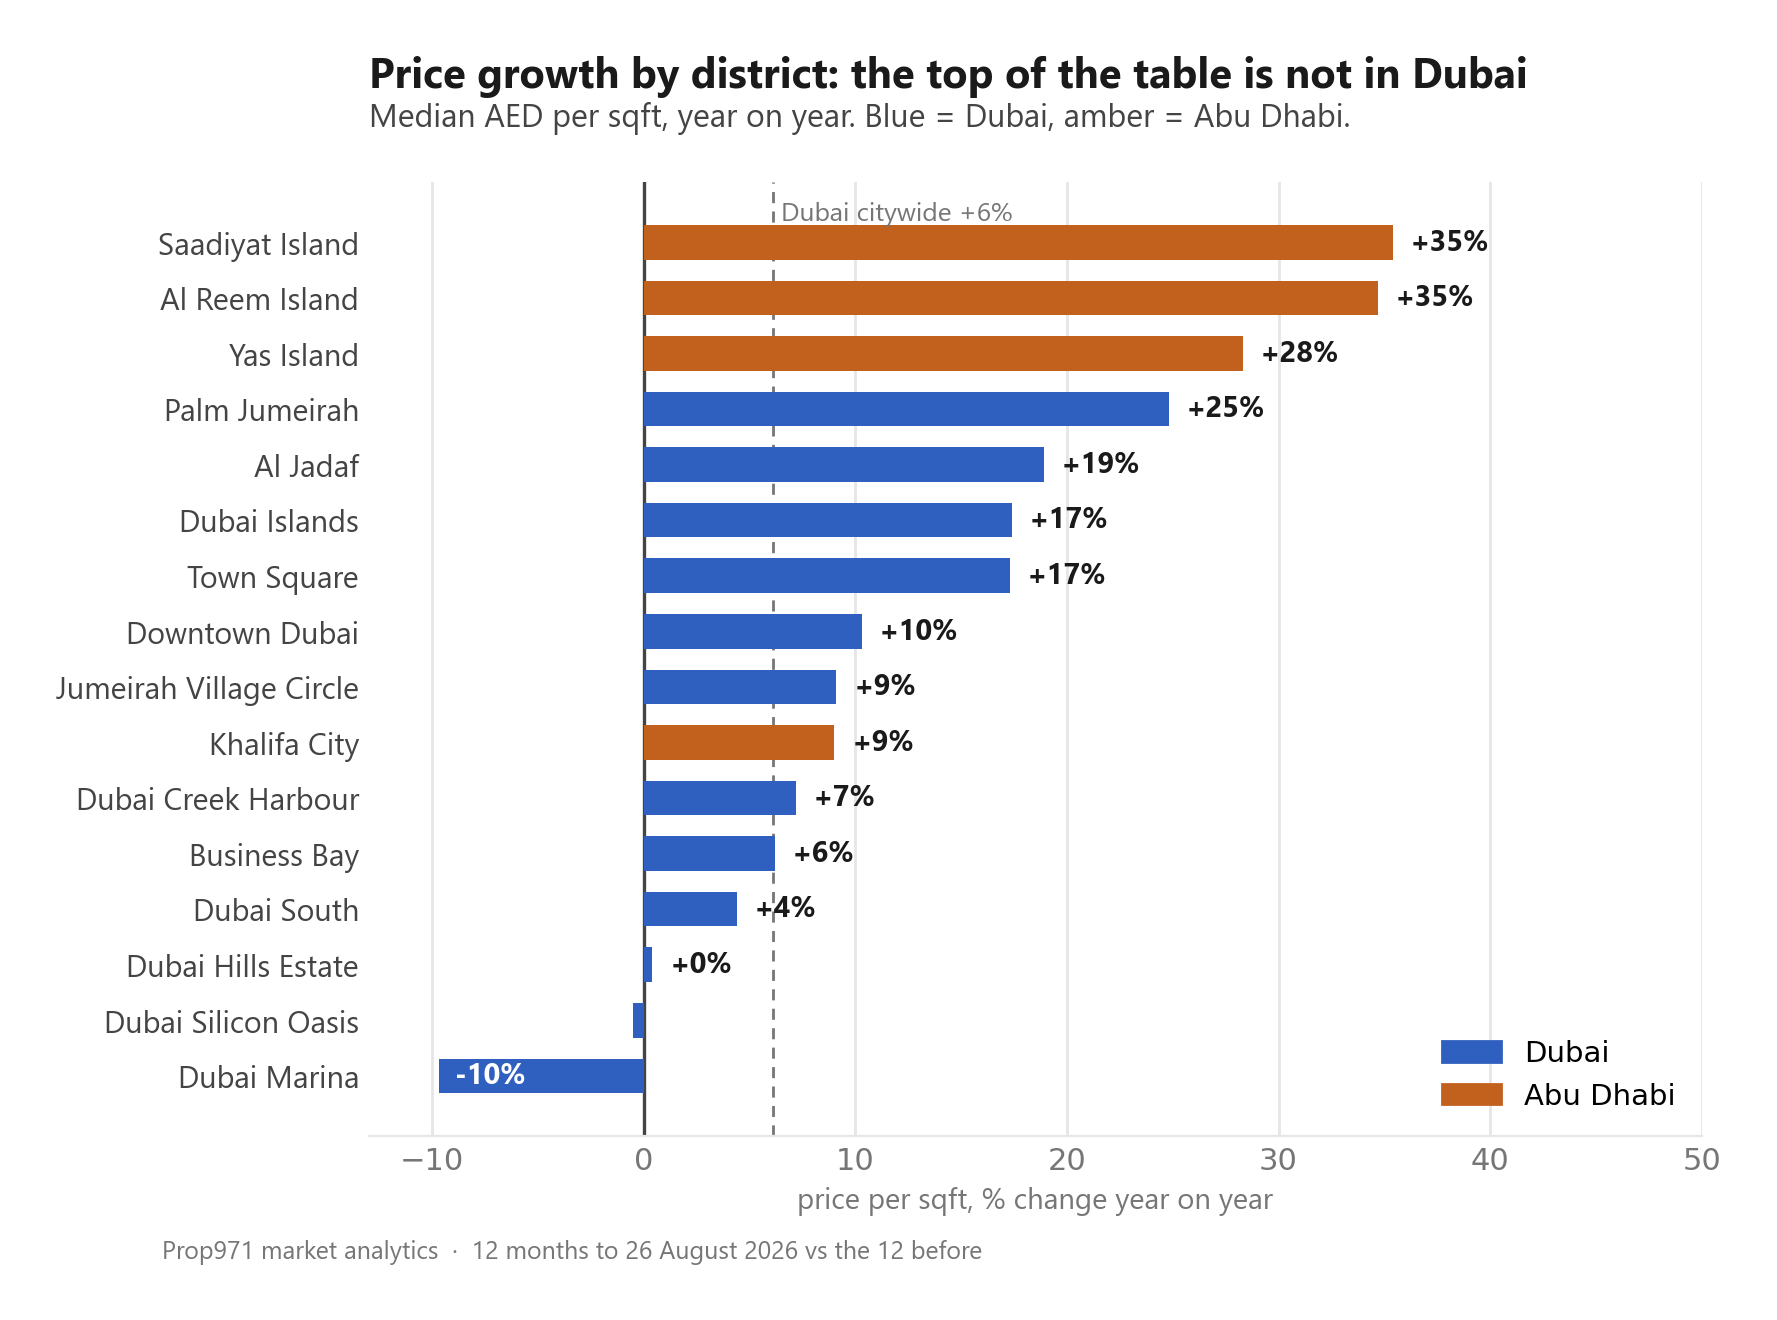
Three things in that chart deserve a second look.
The top of the table is not in Dubai. Saadiyat Island (+35%), Al Reem Island (+35%) and Yas Island (+28%) are all Abu Dhabi, and we come back to them below.
Dubai's leaders are the unfashionable middle. Al Jadaf at +19%, Dubai Islands at +17%, Town Square at +17%: mid-priced districts between AED 1,550 and 2,700 per square foot, not the postcard addresses. Palm Jumeirah is the exception, +25% at AED 3,595 per square foot, the one trophy district still repricing hard.
The famous names underperformed the city. Dubai's overall median rose 6.1% year on year, from about AED 1,632 to AED 1,731 per square foot. Downtown Dubai (+10%) beat it and Business Bay (+6%) matched it. Dubai Hills Estate was flat at under +1%, and Dubai Silicon Oasis slipped half a point after a +16% year. Dubai Marina fell 9.7% while its sale count dropped by 60%.
One test before you chase any number in that chart: check the district's sales volume in the same breath. When a district's volume doubles and its median jumps 40%, the median has usually moved because new launches changed what is selling, not because the flat you would buy repriced by 40%. Growth above roughly 40% year on year is a mix change until proven otherwise. That is exactly the caveat on Al Reem below.
Where the rent actually pays you back
Yield inverts the growth table almost perfectly. Gross yields, computed as median advertised rent over the median price of finished stock in the same district for the same bedroom count:
| District | Gross yield | Price growth YoY |
|---|---|---|
| International City (Dubai) | 8.4% | +5% |
| Khalifa City (Abu Dhabi) | 7.7% | +9% |
| Dubai Production City (Dubai) | 7.5% | +2% |
| Dubai South (Dubai) | 7.1% | +4% |
| Dubai Silicon Oasis (Dubai) | 7.1% | -1% |
| Jumeirah Village Circle (Dubai) | 6.8% | +9% |
| Al Reem Island (Abu Dhabi) | 6.0% | +35% |
| Dubai Hills Estate (Dubai) | 5.9% | 0% |
| Business Bay (Dubai) | 5.8% | +6% |
| Downtown Dubai (Dubai) | 5.6% | +10% |
| Dubai Marina (Dubai) | 5.4% | -10% |
| Saadiyat Island (Abu Dhabi) | 5.4% | +35% |
| Palm Jumeirah (Dubai) | 4.9% | +25% |
The pattern is the whole lesson. The districts nobody brags about at dinner, International City, Silicon Oasis, Production City, Khalifa City, pay 7 to 8% gross. The districts everyone brags about pay 4 to 6%. The tenant does not price in prestige; the buyer does. You are paid for owning where capital does not want to be, and you pay for owning where it does.
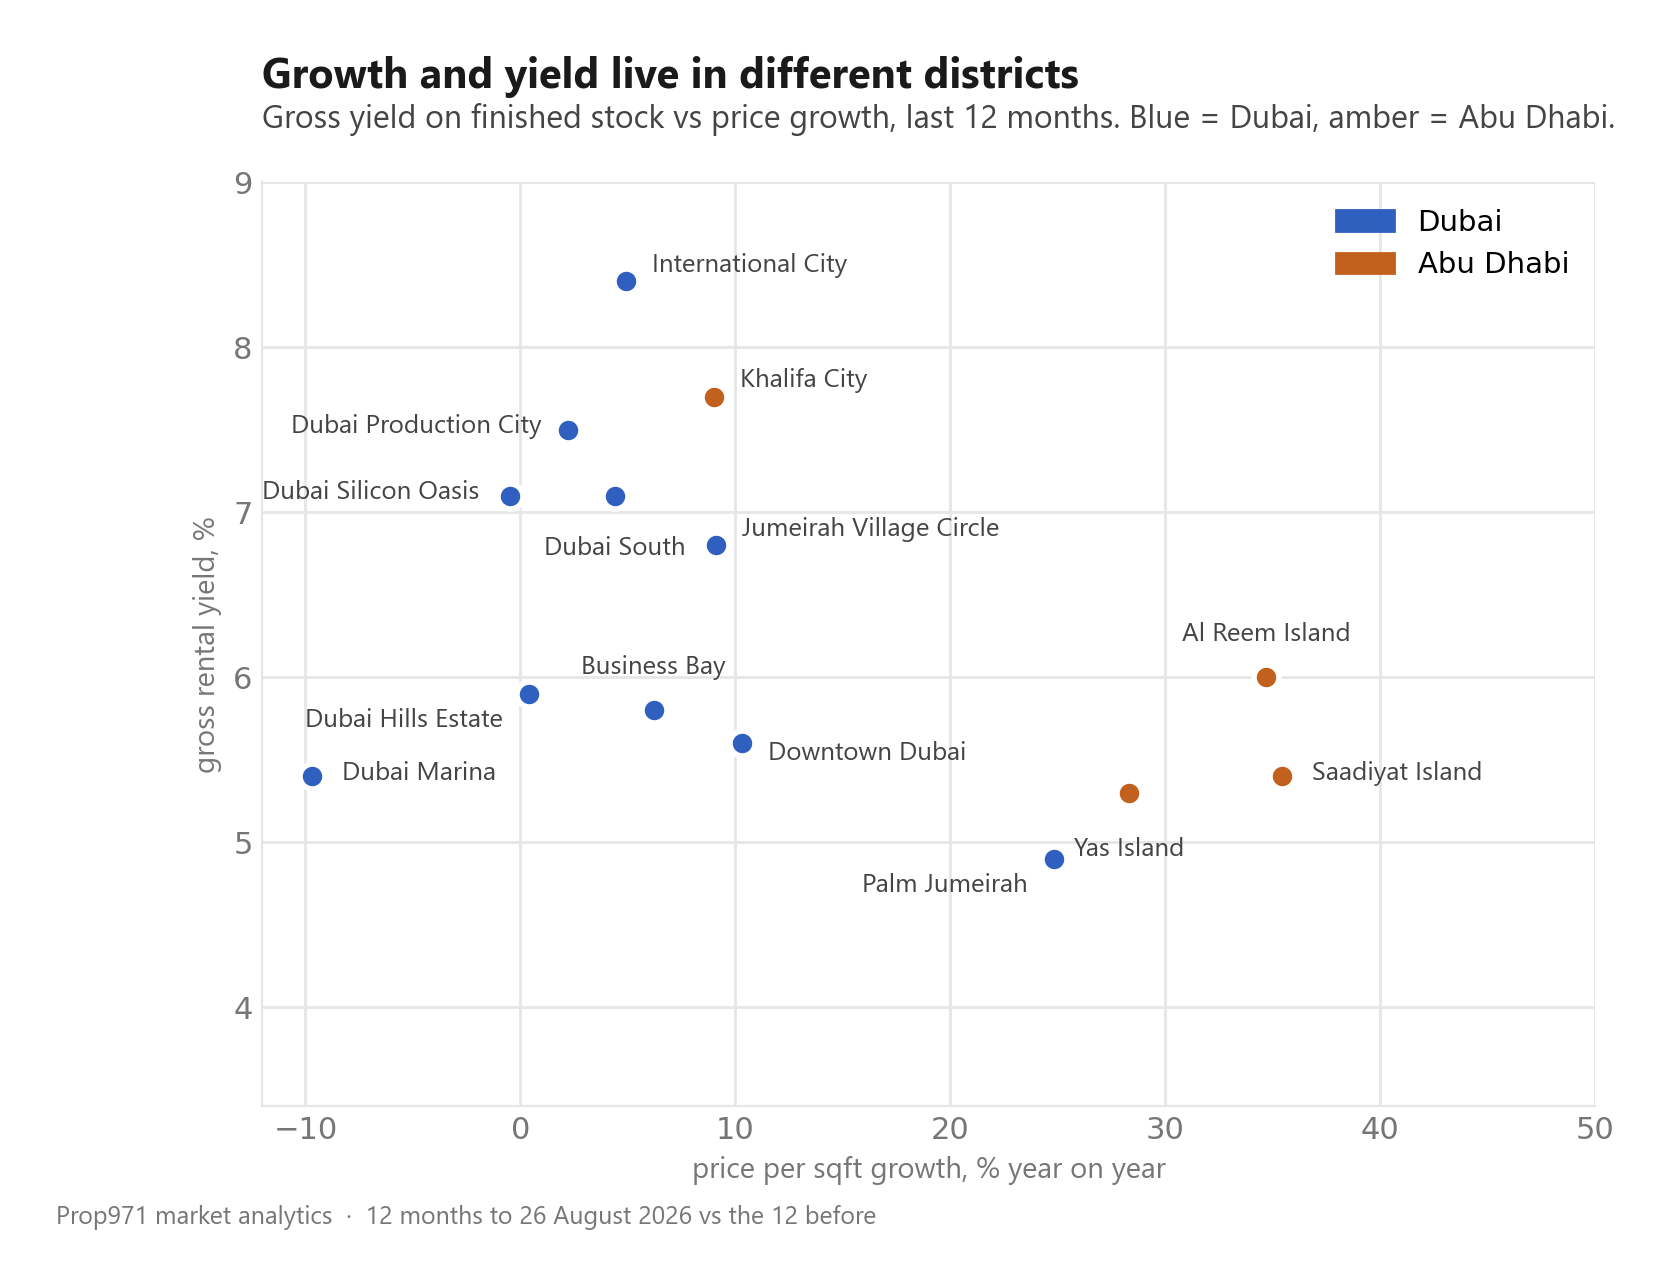
Two rules keep these numbers honest, and both are worth stealing for your own sums. Yields here are computed only against finished property, because an off-plan price cannot produce rent for years and off-plan trades at roughly a 28% premium per square foot anyway; divide today's rent by an off-plan price and you get a number that describes nothing. And they are gross: service charges, vacancy and management come out of that figure before it reaches you.
The liquidity test almost nobody runs
Price growth tells you what happened to owners. Sale count tells you whether you can ever become an ex-owner at that price.
The twelve-month sale counts put the depth in a handful of places: Dubai South cleared over 14k sales, Al Reem Island 8.4k, Jumeirah Village Circle 8.1k, Business Bay 7.3k, Dubai Islands 5.0k. Dubai Marina, for scale, traded 3.3k times, down from 8.2k the year before.
A district that trades ten thousand times a year has a price. A district that trades two hundred times a year has an estimate, and your exit depends on who happens to be looking in the month you list. Before any purchase, ask one question of the ranking that seduced you: how many times did this district actually change hands? Below a few hundred sales a year, every other statistic about it is weather.
Al Reem Island, and the Abu Dhabi case
Al Reem Island in Abu Dhabi is the rare district that shows up in all three rankings at once: prices up 35% year on year, 8.4k sales (up 129%), and a 6.0% gross yield on finished stock that still beats every famous Dubai district in the table above.
The honest caveat first: some of that 35% is the mix-shift effect described earlier. Reem's volume surge came with a wave of new premium launches, which drags the median up even before like-for-like appreciation. The cleaner signals are the yield, which is computed on finished stock only, and the sale count, which is real demand however you slice it. Both hold up. And at a median sale of about AED 1.75 million and AED 1,606 per square foot, Reem still trades at half the price of Saadiyat Island next door.
The rest of the emirate follows the same three-way split as Dubai. Yas Island is the growth-and-volume story: +28% on 4.9k sales, yielding 5.3%. Khalifa City is the income story: 7.7% gross, the highest yield we measured anywhere in Abu Dhabi. Saadiyat is the trophy: AED 3,174 per square foot, +35% and, unlike Reem, on volume that fell 22%, which is repricing rather than mix. It yields 5.4%.
One structural difference tilts the arithmetic: transfer fees. Dubai's standard rate registered with the Dubai Land Department is 4% of the price; Abu Dhabi's registered with ADREC is typically 2%. On a AED 2 million purchase that is AED 40k of difference before either unit does anything, roughly a full year of the yield gap between a famous district and an unfamous one.
Best areas to invest in Dubai 2026: the shortlist
Matching the three rankings to what a buyer actually wants:
- Growth first: Palm Jumeirah was Dubai's cleanest premium repricing at +25% with no mix-shift asterisk; Al Jadaf and Dubai Islands led the mid-market at +19% and +17%. Across the border, Yas Island's +28% came on real volume.
- Income first: International City at 8.4% gross, Dubai Production City at 7.5%, Khalifa City at 7.7% in Abu Dhabi. None will ever be on a postcard. That is what you are being paid for.
- Balance: Jumeirah Village Circle is the only Dubai district in our tables pairing growth near double digits (+9%) with a yield of 6.8% and eight thousand sales a year. Al Reem Island is Abu Dhabi's version of the same argument with more growth and more caveat.
- The re-rating watch: Downtown Dubai beat the city's 6% and Business Bay matched it, while yielding 5.6% and 5.8%, the profile of mature districts now priced for stability rather than surprise.
What none of these are is a prediction. Last year's +35% is a fact about last year; the only way to hold the argument together is to re-check the three numbers on the district you shortlist, at the moment you buy.
The three checks that beat any ranking
Any best-areas list, this one included, goes stale the month after it is computed. The checks do not.
1. Matched windows. Compare a full twelve months against the previous full twelve. A hot quarter annualised is marketing, not data.
2. Sample size. Below 150 sales per window, a district median is an anecdote wearing a suit. Below a few hundred a year, so is your exit.
3. Finished-stock yields. Rent divided by an off-plan price flatters the number by the size of the off-plan premium, roughly 28% per square foot.
Running those checks by hand means pulling every district's medians, volumes and rents for two matched windows, which is exactly the dull, repetitive work people do once and never refresh. Our market analytics hold the same transaction data these tables were computed from, cut by district, bedroom count and off-plan status, so re-checking a shortlisted area takes minutes rather than a weekend.
FAQ
What is the best area to invest in Dubai right now?
It depends on which of the three metrics you optimise for: Palm Jumeirah led clean price growth (+25% year on year), International City led gross yield (8.4%), and Dubai South led liquidity with over 14k sales in twelve months. Jumeirah Village Circle is the strongest single balance of all three: +9% growth, 6.8% yield, 8.1k sales.
Which area in Dubai has the highest rental yield?
International City, at about 8.4% gross on finished stock, followed by Khalifa City in Abu Dhabi (7.7%) and Dubai Production City (7.5%). The yield table is led by affordable districts; the famous ones pay 4.9 to 5.8%.
Is Dubai Marina still a good investment?
The last twelve months were poor: the median price per square foot fell 9.7% while sales volume dropped 60%, and the yield of 5.4% sits mid-table. It remains one of Dubai's most liquid premium districts, but the data currently reads as a repricing, not a bargain window.
Is Abu Dhabi better than Dubai for property investment?
Abu Dhabi produced the stronger price growth last year (Saadiyat +35%, Al Reem +35%, Yas +28%, with a mix-shift caveat on Reem) and its transfer fee is typically 2% against Dubai's 4%. Dubai offers far deeper liquidity: 330k transactions over two years against 46k. Growth favoured Abu Dhabi; the ease of getting in and out still favours Dubai.
What is a good rental yield in Dubai?
Citywide gross yields on finished stock run about 7.0% for studios, 5.3% for one-beds, 3.7% for two-beds and 3.7% for three-beds, so anything above those for its bedroom count is beating the market. Always compute against finished prices and treat the figure as gross, before service charges and vacancy.
Should I buy off-plan or ready property in a growth area?
Off-plan trades at roughly a 28% premium per square foot over finished stock, so it needs the district's growth to continue just to close its own gap. Ready property starts producing rent immediately and its price reflects a market that exists; off-plan is a bet the district's chart keeps its slope.
References
Figures in this article are computed from official UAE property transaction records (DLD, ADREC) via Prop971 market analytics, including transactions up to 26 August 2026.


