

Check price growth for any Dubai project →
A project's price growth is only as good as the sales behind it. Of the 2,231 Dubai apartment projects with real estate transactions in Dubai over the last twelve months, 844 had twenty or more sales in each of the last two years, enough to measure growth with some confidence. 304 had fifty.
The rest still get growth figures quoted, in brochures, listings and conversations. This guide shows how many sales a figure needs, what happens below that, and which questions to ask before you believe one.
Key takeaways
- 1,610 Dubai apartment projects had at least five sales in both years, the bare minimum to compute growth. Only 844 had twenty and 304 had fifty.
- With five sales, two random halves of the same year's sales differ by more than 10% in 25.8% of tests. With fifty, in 2.5%.
- 39.5% of the last year's apartment sales were in projects with too few sales in one of the two years to measure, mostly new launches.
- Among projects with enough sales, the typical one rose 2.5% per square foot, and two in three rose.
- Comparing the same layouts changes a project's growth figure by more than five points in 22.3% of projects.
Why sample size decides whether growth is real
The cleanest way to see noise is to measure something that did not change. Take one project's sales from a single year, split them at random into two groups, and compare the two medians. Nothing moved between the groups, so any gap is chance.
With five sales in each group, the two medians differed by a median 5.1%, and by more than 10% in 25.8% of tests. With ten sales the 10% gap appeared in 13.8% of tests, with twenty in 6.6%, and with fifty in 2.5%.
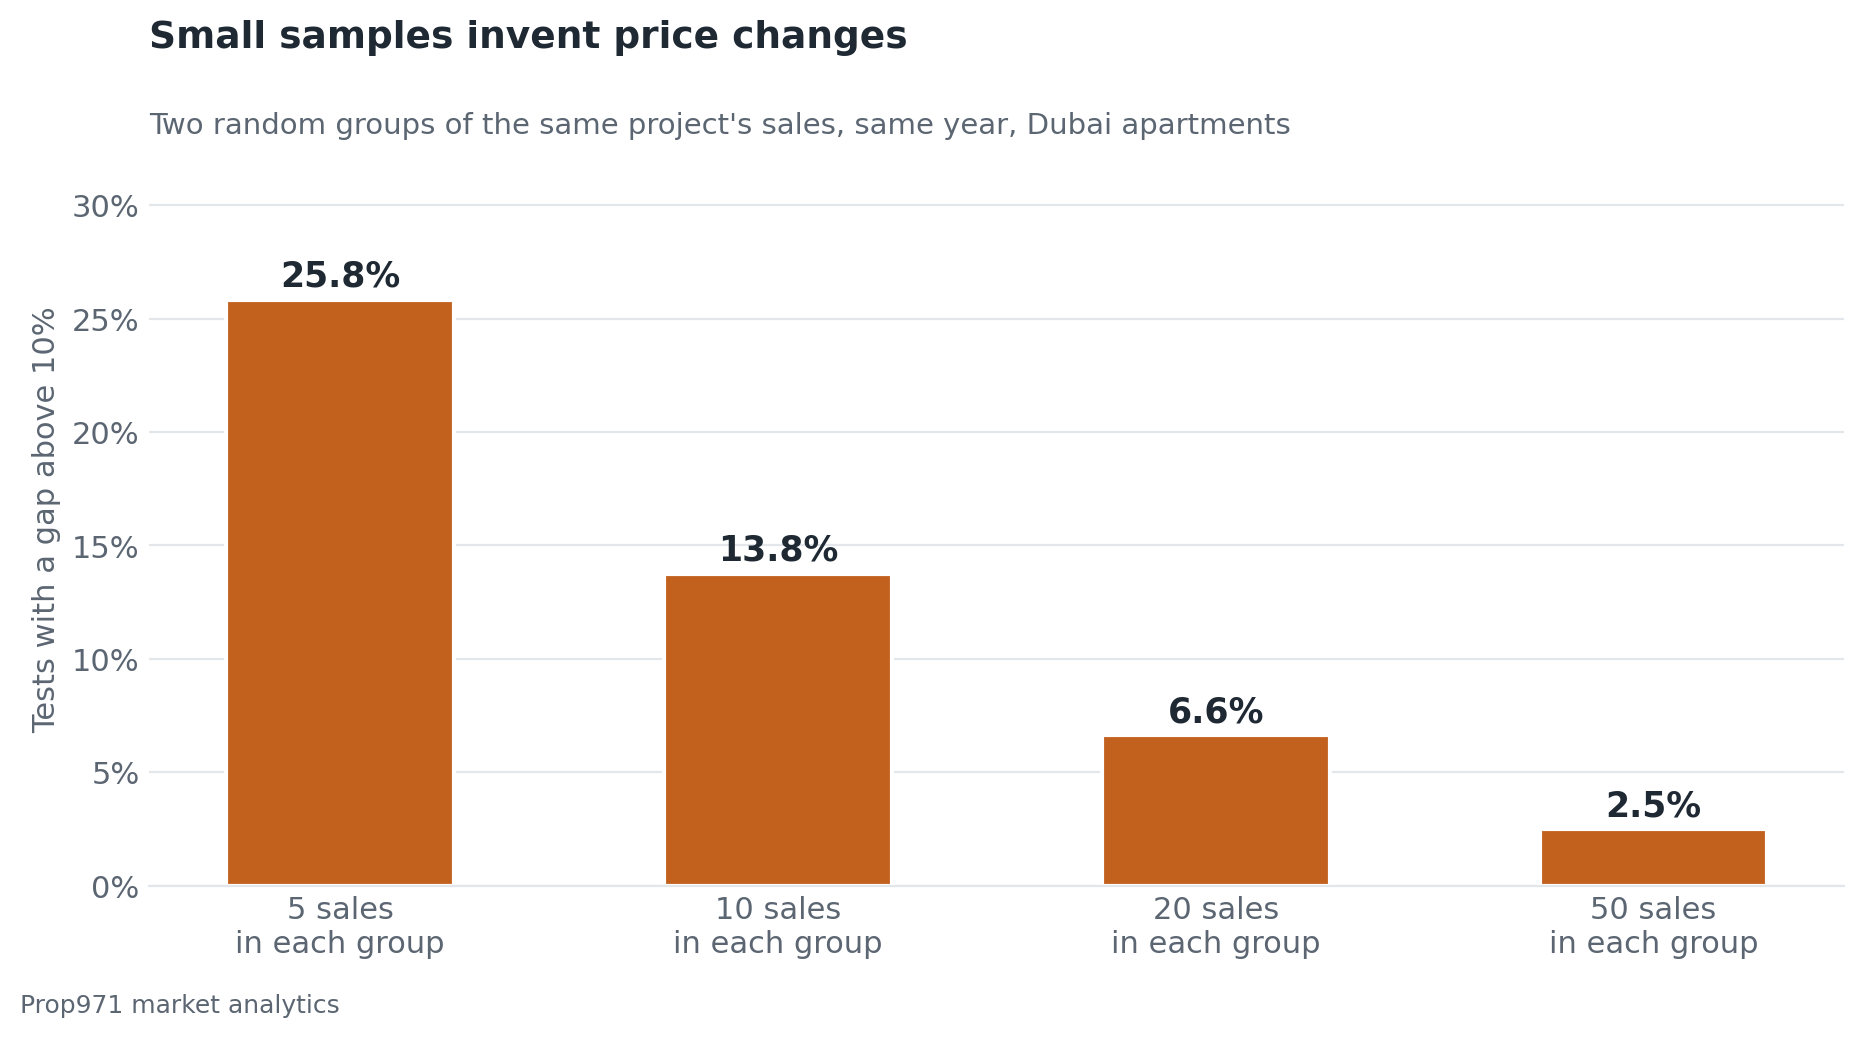
So a project that "rose 10%" on five sales a year has told you very little: a gap that size turns up by chance in about a quarter of tests even when nothing changed. The same 10% on fifty sales a year is a finding.
How many real estate transactions in Dubai a project needs
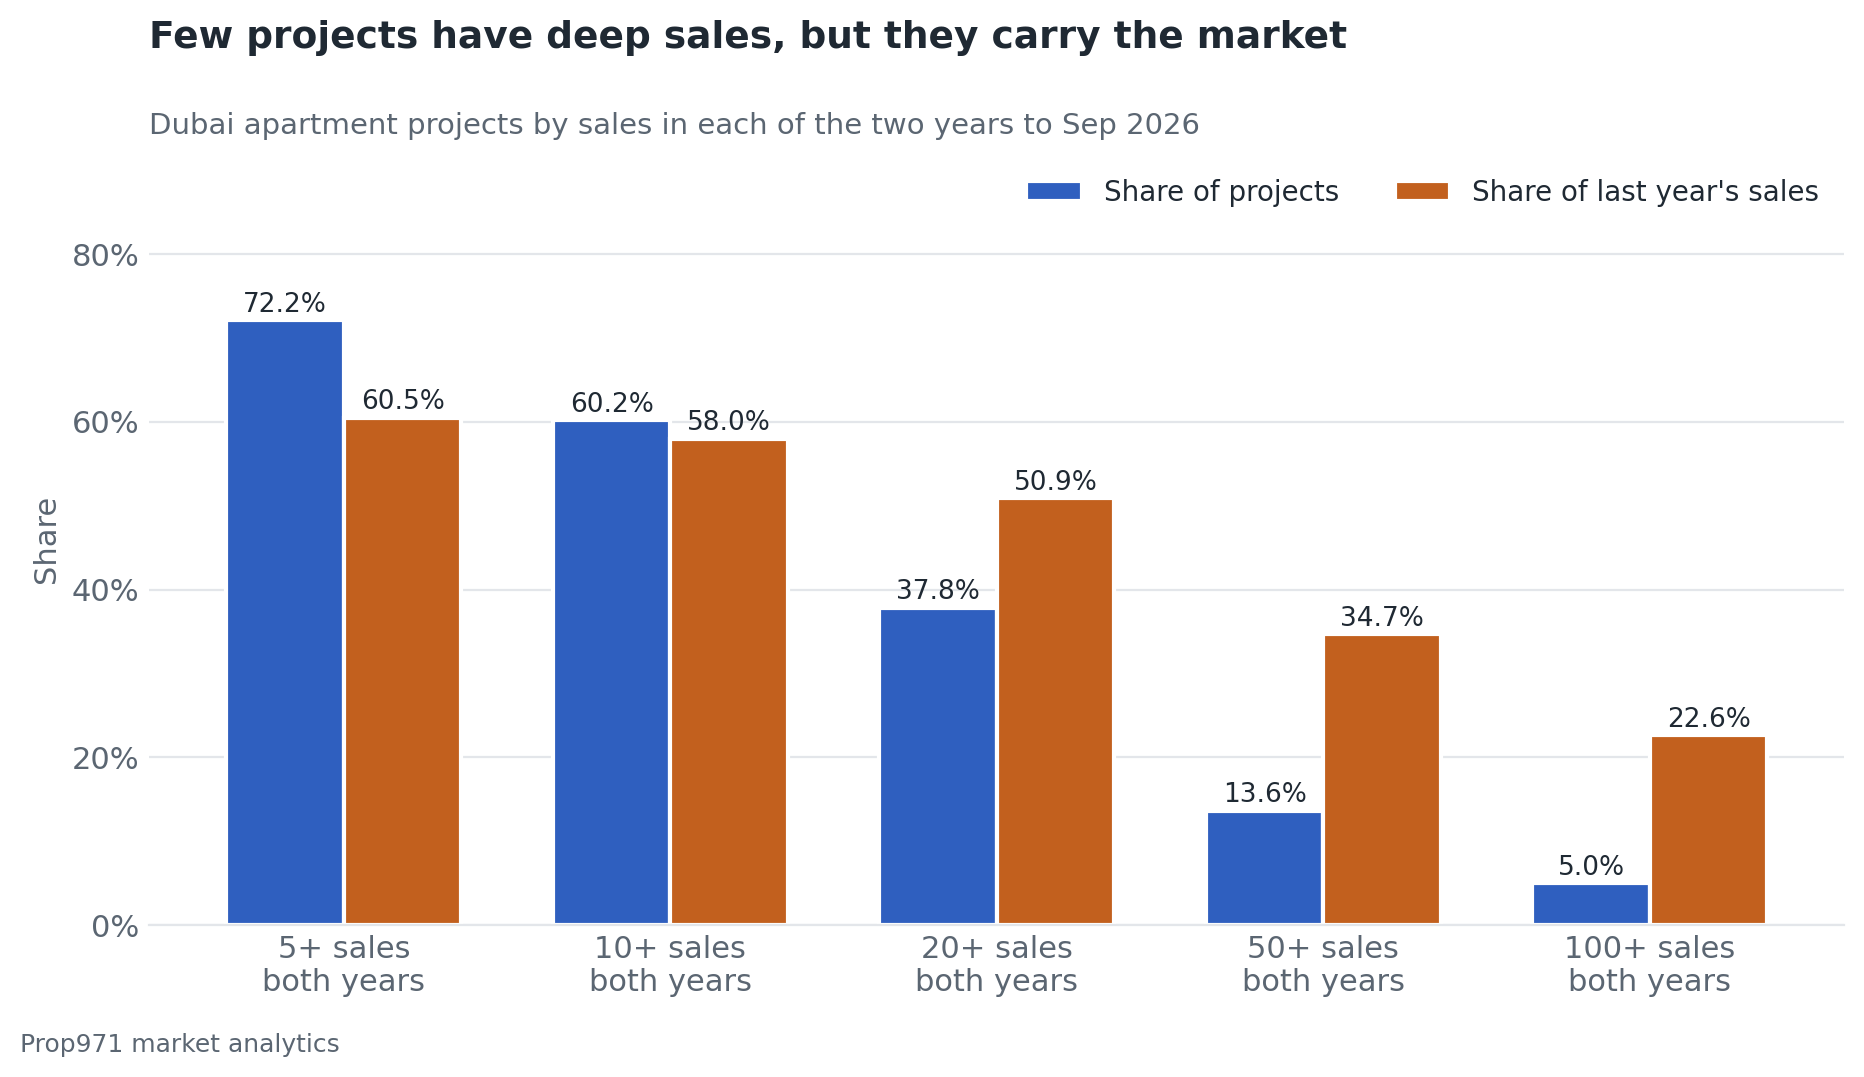
The threshold depends on the claim. Five sales a year is enough to compute a figure, twenty enough to quote one, and fifty enough to read a single-digit change. Here is how many Dubai apartment projects clear each bar.
| Minimum sales in each year | Projects | Share of projects | Share of last year’s sales | Chance of a 10% gap from noise alone |
|---|---|---|---|---|
| 5 | 1,610 | 72.2% | 60.5% | 25.8% |
| 10 | 1,343 | 60.2% | 58.0% | 13.8% |
| 20 | 844 | 37.8% | 50.9% | 6.6% |
| 50 | 304 | 13.6% | 34.7% | 2.5% |
| 100 | 112 | 5.0% | 22.6% | 1.3% |
Raising the bar removes most projects but keeps much of the market. At twenty sales a year, 37.8% of projects qualify and they hold 50.9% of last year's apartment sales. At fifty, 13.6% of projects hold 34.7%. Big projects carry the market, and they are also the ones whose growth figures can be trusted.
Then there is the part that cannot be measured at all yet. 406 projects that sold apartments in the last year had no sales the year before, and they took 37.1% of last year's sales. Counting every project below five sales in either year, 39.5% of the market has no growth figure to quote. For those, the honest answer to "how much has it gone up?" is "it has not existed long enough to say". Our new projects page tracks the latest launches, most of them too young for a growth figure.
What growth looks like when the sample is big enough
Among the 1,610 projects with at least five sales in both years, the median price per square foot rose 2.7%, and 65.5% of projects rose. Among the 844 with twenty or more, the median rise was 2.5%, and 66.0% rose.
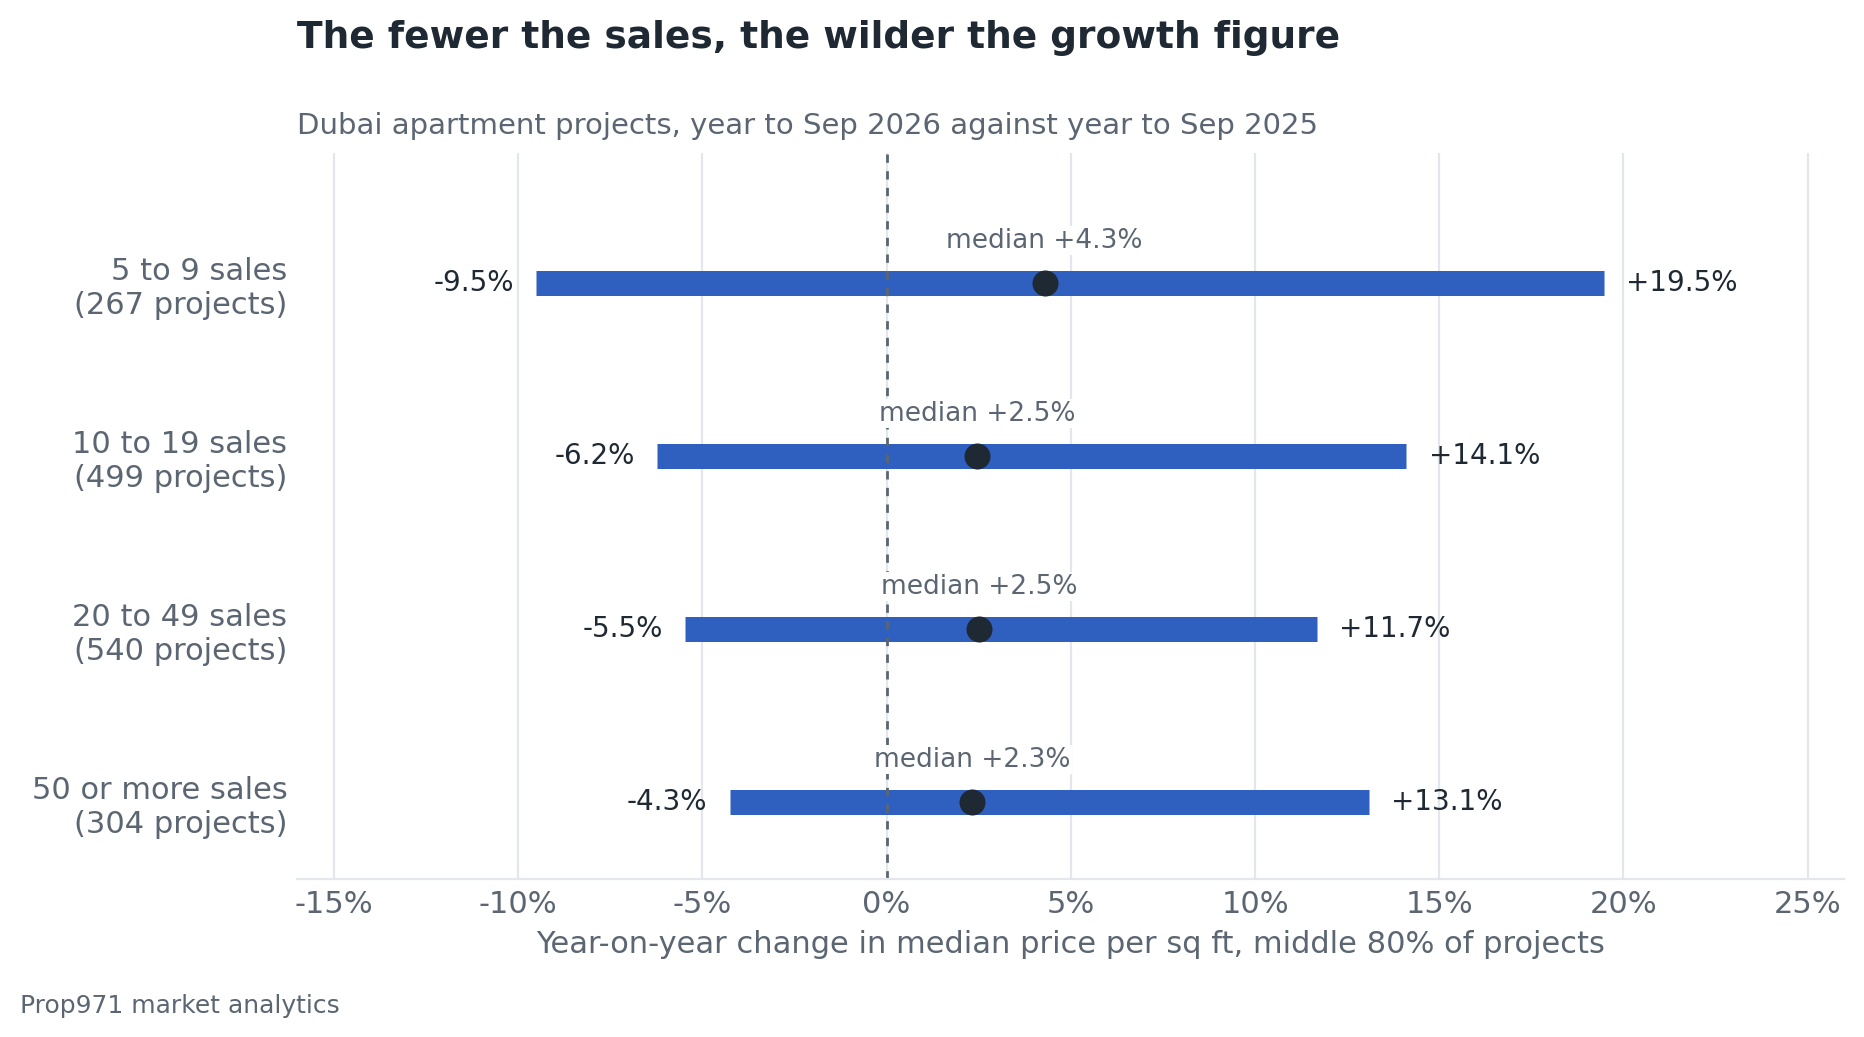
The spread tells the same story as the noise test. For projects with five to nine sales a year, the middle 80% of growth figures ran from minus 9.5% to plus 19.5%, and 22.1% moved more than 15% either way. With fifty or more sales the range tightened to minus 4.3% to plus 13.1%, and only 7.9% moved more than 15%. The extremes live in the small samples, which is exactly where they should not be trusted.
Same project, different flats: the layout trap
A project's median moves when it sells a different mix of homes, even if no price changed. A year heavy in studios and a year heavy in larger flats will not share a median per square foot, because each bedroom count prices differently.
Comparing like for like, the same layouts across both years, changed the growth figure by more than five points in 22.3% of the 1,581 projects where that comparison was possible, and by more than ten points in 8.2%. One project in five, in other words, quotes a number that is partly about which flats sold.
Off-plan projects measure the price list, not the market
What a project sold also changes what its growth means. In projects that sold only off-plan over the last year, growth measures the developer's price list from one launch phase to the next: a median 1.5%. In projects that sold only resales, it measures what owners agreed with buyers: a median 4.0%. Both are real numbers, but they answer different questions, and a launch phase priced up by the developer is not yet evidence that anyone has resold at that level. Our analysis of which Dubai off-plan projects are cheaper than resale compares the two price levels directly.
What a Dubai property price index can and cannot tell you
A Dubai property price index adds every sale together, which removes the small-sample problem but brings in a mix problem. The median Dubai apartment price per square foot moved just 0.9% between the two years, while the typical project with enough sales rose 2.5%. The difference is mostly what sold: new launches with no sales the year before took 37.1% of last year's sales, and earlier this year off-plan buying shifted toward lower-priced districts.
So a Dubai real estate price index answers "what did the average sale cost?", which is a different question from "what happened to the price of homes like mine?". Our district table of the Dubai off-plan premium shows the same effect between new and resale homes, and our guide to Dubai home prices tracks the citywide figures.
How to read any project's price growth
1. Ask for the sales count in each year. Under ten, treat the figure as a rumour. Twenty or more is quotable; fifty or more can carry single-digit claims.
2. Check the layouts match. A growth figure that mixes studios one year and two-bedroom homes the next is measuring the mix.
3. Separate off-plan from resale. Growth in an off-plan-only project is the price list; resales show what buyers paid each other.
4. Compare with the district. A project rising 20% in a district rising 3% needs an explanation, and a small sample is the most common one.
Collecting those counts by hand means pulling every sale of the project, by layout and by type, for two years. The Prop971 growth dashboard ranks project growth and lists a project only where both years have at least five sales, so the first check is done before you look. Ownership and registration rules for buyers sit with the Dubai Land Department, and the UAE government's housing guide covers who may buy where.
FAQ
How many sales does a Dubai project need to measure price growth?
At least five in each year to compute a figure, twenty to quote one with some confidence, and fifty to read a single-digit change. Of 2,231 Dubai apartment projects with sales in the last twelve months, 1,610 had five or more in both years, 844 had twenty and 304 had fifty.
How reliable is a price growth figure based on a few sales?
Not very. Splitting the same year's sales of a project into two random groups of five, the medians differed by more than 10% in 25.8% of tests, though nothing had changed. With fifty sales a side that happened in 2.5% of tests.
How much did Dubai apartment prices rise this year?
Among Dubai apartment projects with twenty or more sales in each year, the typical project's price per square foot rose 2.5% from the year to September 2025 to the year to September 2026, and 66.0% of those projects rose.
Is there a Dubai property price index for each project?
Not an official one. Growth can be measured project by project only where there are enough sales: 844 Dubai apartment projects had twenty or more in each of the last two years. Prop971's growth dashboard lists project growth only where both years have at least five sales.
Why do new Dubai projects have no price growth figure?
Because there is nothing to compare with. 406 projects that sold apartments in the last twelve months had no sales the year before, and they took 37.1% of those sales. Growth needs two years of real estate transactions in Dubai, not one.
Why does off-plan price growth differ from resale growth?
They measure different prices. Off-plan-only projects rose a median 1.5%, which tracks the developer's price list between launch phases. Resale-only projects rose a median 4.0%, which tracks what owners and buyers agreed.
References
Figures in this article are computed from official UAE property transaction records (DLD, ADREC) via Prop971 market analytics, including transactions up to 30 September 2026.


